BELMONT, CA ZIP Code
| City | BELMONT |
| State | California |
| ZIP Codes count | 1 (see all) |
| Post offices count | 1 (see all) |
| Total population | 27,110 (see all) |
ZIP Code in BELMONT, California
94002
This list contains only 5-digit ZIP codes. Use our zip code lookup by address feature to get the full 9-digit (ZIP+4) code.
List of BELMONT, CA ZIP Codes
| ZIP | TYPE | POPU |
|---|---|---|
| 94002 | STANDARD | 28,201 |
Post offices
BELMONT — Post Office™ 640 MASONIC WAY BELMONT, CA 94002-9998 |
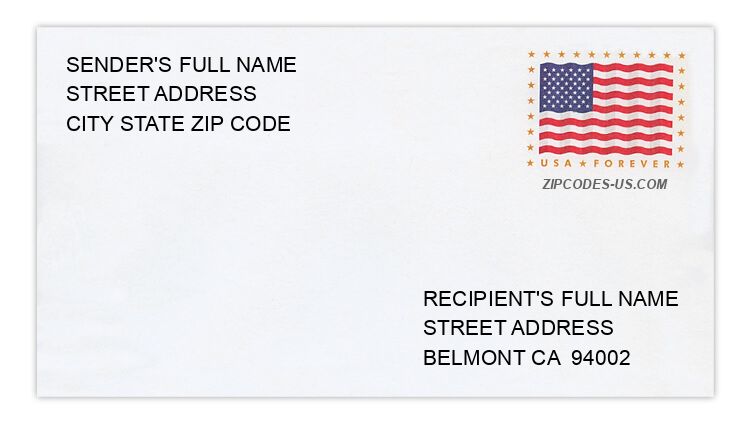
Envelope example
On the bottom center of the envelope, write the address you want your letter delivered to. Include the following on separate lines:
- Recipient's full name
- Full street address
- City, State, and ZIP Code
Using the same format, write the return address in the top left corner.
Using the full ZIP+4 Code when mailing via the USPS ensures the fastest, most accurate mailing possible. If you are not sure of the full 9-digit ZIP Code, use the 5-digit ZIP Code to avoid loss of letter or package.
The recipient address information is provided for your reference.
Address example
1945 ALDEN ST
BELMONT CA 94002-1708
BELMONT CA 94002-1708
482 CLUB DR
BELMONT CA 94002-3382
BELMONT CA 94002-3382
2728 COMSTOCK CIR
BELMONT CA 94002-2905
BELMONT CA 94002-2905
80 LAUREL CT
BELMONT CA 94002-2325
BELMONT CA 94002-2325
2564 SHERBORNE DR
BELMONT CA 94002-2921
BELMONT CA 94002-2921
1429 SUNNYSLOPE AVE
BELMONT CA 94002-3729
BELMONT CA 94002-3729
Map
Hover over the map to see the ZIP code
Census data for BELMONT, CA
Demographic and housing estimates in BELMONT, CA
| Total population | 27,110 |
| Male | 13,527 |
| Female | 13,583 |
| Total population | 27,110 |
| Under 5 years | 1,676 |
| 5 to 9 years | 1,874 |
| 10 to 14 years | 1,715 |
| 15 to 19 years | 1,526 |
| 20 to 24 years | 1,253 |
| 25 to 34 years | 3,132 |
| 35 to 44 years | 4,381 |
| 45 to 54 years | 3,754 |
| 55 to 59 years | 1,970 |
| 60 to 64 years | 1,323 |
| 65 to 74 years | 2,463 |
| 75 to 84 years | 1,307 |
| 85 years and over | 736 |
| Median age (years) | 39.8 |
| Under 18 years | 6,312 |
| 16 years and over | 21,442 |
| 18 years and over | 20,798 |
| 21 years and over | 20,055 |
| 62 years and over | 5,168 |
| 65 years and over | 4,506 |
| Total population | 27,110 |
| One race | 25,508 |
| White | 16,839 |
| Black or African American | 326 |
| American Indian and Alaska Native | 53 |
| Asian | 7,685 |
| Native Hawaiian and Other Pacific Islander | 112 |
| Some other race | 493 |
| Two or more races | 1,602 |
| Citizen, VOTING AGE 18 and over population | 17,677 |
| Male Citizen, VOTING AGE 18 and over population | 8,459 |
| Female Citizen, VOTING AGE 18 and over population | 9,218 |
Social characteristics in BELMONT, CA
| Total households | 10,328 |
| Family households (families) | 7,054 |
| Married-couple family | 6,070 |
| Male householder, no wife present, family | 243 |
| Female householder, no husband present, family | 741 |
| Nonfamily households | 3,274 |
| Average household size | 2.57 |
| Average family size | 3.14 |
Economic characteristics in BELMONT, CA
| Total households | 10,328 |
| Less than $10,000 | 267 |
| $10,000 to $14,999 | 292 |
| $15,000 to $24,999 | 372 |
| $25,000 to $34,999 | 418 |
| $35,000 to $49,999 | 631 |
| $50,000 to $74,999 | 988 |
| $75,000 to $99,999 | 884 |
| $100,000 to $149,999 | 1,740 |
| $150,000 to $199,999 | 1,351 |
| $200,000 or more | 3,385 |
| Median household income (dollars) | 135,342 |
Housing characteristics in BELMONT, CA
| Total housing units | 10,963 |
| Occupied housing units | 10,328 |
| Vacant housing units | 635 |
| Total housing units | 10,963 |
| 1-unit, detached | 6,288 |
| 1-unit, attached | 604 |
| 2 units | 72 |
| 3 or 4 units | 321 |
| 5 to 9 units | 469 |
| 10 to 19 units | 933 |
| 20 or more units | 2,262 |
| Mobile home | 14 |
| Boat, RV, van, etc. | 0 |
| Total housing units | 10,963 |
| Built 2014 or later | 18 |
| Built 2010 to 2013 | 0 |
| Built 2000 to 2009 | 297 |
| Built 1990 to 1999 | 757 |
| Built 1980 to 1989 | 976 |
| Built 1970 to 1979 | 2,362 |
| Built 1960 to 1969 | 2,614 |
| Built 1950 to 1959 | 2,628 |
| Built 1940 to 1949 | 899 |
| Built 1939 or earlier | 412 |
| Total housing units | 10,963 |
| 1 room | 546 |
| 2 rooms | 740 |
| 3 rooms | 1,473 |
| 4 rooms | 1,478 |
| 5 rooms | 1,638 |
| 6 rooms | 1,872 |
| 7 rooms | 1,338 |
| 8 rooms | 873 |
| 9 rooms or more | 1,005 |
| Median rooms | 5.3 |
| Total housing units | 10,963 |
| No bedroom | 672 |
| 1 bedroom | 2,010 |
| 2 bedrooms | 1,941 |
| 3 bedrooms | 3,722 |
| 4 bedrooms | 2,060 |
| 5 or more bedrooms | 558 |
| Occupied housing units | 10,328 |
| Owner-occupied | 6,256 |
| Renter-occupied | 4,072 |
| Average household size of owner-occupied unit | 2.80 |
| Average household size of renter-occupied unit | 2.21 |
| Occupied housing units | 10,328 |
| Moved in 2017 or later | 541 |
| Moved in 2015 to 2016 | 1,124 |
| Moved in 2010 to 2014 | 3,040 |
| Moved in 2000 to 2009 | 2,210 |
| Moved in 1990 to 1999 | 1,467 |
| Moved in 1989 and earlier | 1,946 |
| Owner-occupied units | 6,256 |
| Less than $50,000 | 81 |
| $50,000 to $99,999 | 52 |
| $100,000 to $149,999 | 36 |
| $150,000 to $199,999 | 14 |
| $200,000 to $299,999 | 29 |
| $300,000 to $499,999 | 134 |
| $500,000 to $999,999 | 1,135 |
| $1,000,000 or more | 4,775 |
| Median (dollars) | 1,383,700 |
| Owner-occupied units | 6,256 |
| Housing units with a mortgage | 4,481 |
| Housing units without a mortgage | 1,775 |
| Occupied units paying rent | 4,010 |
| Less than $500 | 76 |
| $500 to $999 | 168 |
| $1,000 to $1,499 | 362 |
| $1,500 to $1,999 | 1,079 |
| $2,000 to $2,499 | 1,087 |
| $2,500 to $2,999 | 609 |
| $3,000 or more | 629 |
| Median (dollars) | 2,147 |
| No rent paid | 62 |
Data is based on 2018 Census
ZIP Codes for other locations
State for BELMONT
California ZIP CodesOther cities in California