BONSALL, CA ZIP Code
| City | BONSALL |
| State | California |
| ZIP Codes count | 1 (see all) |
| Post offices count | 1 (see all) |
| Total population | 4,464 (see all) |
ZIP Code in BONSALL, California
92003
This list contains only 5-digit ZIP codes. Use our zip code lookup by address feature to get the full 9-digit (ZIP+4) code.
List of BONSALL, CA ZIP Codes
| ZIP | TYPE | POPU |
|---|---|---|
| 92003 | STANDARD | 4,299 |
Post offices
BONSALL — Post Office™ 5521 MISSION RD STE D BONSALL, CA 92003-9998 |
Envelope example
On the bottom center of the envelope, write the address you want your letter delivered to. Include the following on separate lines:
- Recipient's full name
- Full street address
- City, State, and ZIP Code
Using the same format, write the return address in the top left corner.
Using the full ZIP+4 Code when mailing via the USPS ensures the fastest, most accurate mailing possible. If you are not sure of the full 9-digit ZIP Code, use the 5-digit ZIP Code to avoid loss of letter or package.
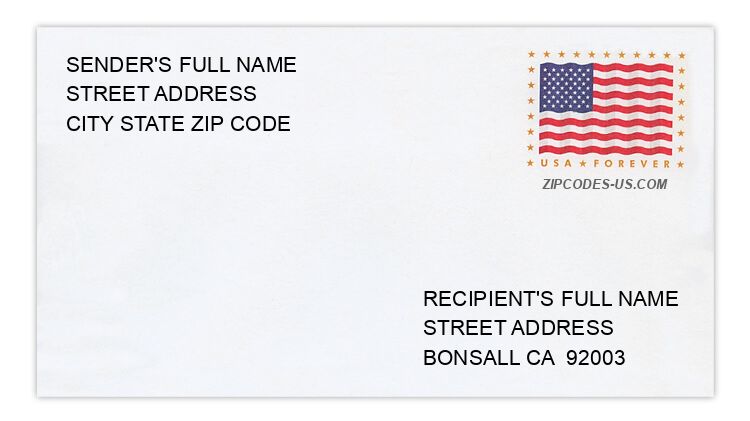
The recipient address information is provided for your reference.
Address example
1265 CLOS DUVAL
BONSALL CA 92003-6114
BONSALL CA 92003-6114
4243 ENTRADA AL SOL
BONSALL CA 92003-4927
BONSALL CA 92003-4927
31743 NIRA LN
BONSALL CA 92003-4803
BONSALL CA 92003-4803
31801 PASEO LINDO
BONSALL CA 92003-4903
BONSALL CA 92003-4903
5977 THOROUGHBRED LN
BONSALL CA 92003-3510
BONSALL CA 92003-3510
31980 VIA GIANNELLI
BONSALL CA 92003-4214
BONSALL CA 92003-4214
Map
Hover over the map to see the ZIP code
Census data for BONSALL, CA
Demographic and housing estimates in BONSALL, CA
| Total population | 4,464 |
| Male | 2,444 |
| Female | 2,020 |
| Total population | 4,464 |
| Under 5 years | 260 |
| 5 to 9 years | 135 |
| 10 to 14 years | 251 |
| 15 to 19 years | 360 |
| 20 to 24 years | 177 |
| 25 to 34 years | 533 |
| 35 to 44 years | 395 |
| 45 to 54 years | 678 |
| 55 to 59 years | 409 |
| 60 to 64 years | 344 |
| 65 to 74 years | 568 |
| 75 to 84 years | 250 |
| 85 years and over | 104 |
| Median age (years) | 47.3 |
| Under 18 years | 839 |
| 16 years and over | 3,739 |
| 18 years and over | 3,625 |
| 21 years and over | 3,417 |
| 62 years and over | 1,104 |
| 65 years and over | 922 |
| Total population | 4,464 |
| One race | 4,223 |
| White | 3,461 |
| Black or African American | 56 |
| American Indian and Alaska Native | 20 |
| Asian | 281 |
| Native Hawaiian and Other Pacific Islander | 0 |
| Some other race | 405 |
| Two or more races | 241 |
| Citizen, VOTING AGE 18 and over population | 3,470 |
| Male Citizen, VOTING AGE 18 and over population | 1,849 |
| Female Citizen, VOTING AGE 18 and over population | 1,621 |
Social characteristics in BONSALL, CA
| Total households | 1,594 |
| Family households (families) | 1,142 |
| Married-couple family | 958 |
| Male householder, no wife present, family | 84 |
| Female householder, no husband present, family | 100 |
| Nonfamily households | 452 |
| Average household size | 2.80 |
| Average family size | 3.31 |
Economic characteristics in BONSALL, CA
| Total households | 1,594 |
| Less than $10,000 | 61 |
| $10,000 to $14,999 | 56 |
| $15,000 to $24,999 | 81 |
| $25,000 to $34,999 | 36 |
| $35,000 to $49,999 | 160 |
| $50,000 to $74,999 | 325 |
| $75,000 to $99,999 | 178 |
| $100,000 to $149,999 | 264 |
| $150,000 to $199,999 | 186 |
| $200,000 or more | 247 |
| Median household income (dollars) | 83,750 |
Housing characteristics in BONSALL, CA
| Total housing units | 1,706 |
| Occupied housing units | 1,594 |
| Vacant housing units | 112 |
| Total housing units | 1,706 |
| 1-unit, detached | 1,155 |
| 1-unit, attached | 206 |
| 2 units | 0 |
| 3 or 4 units | 68 |
| 5 to 9 units | 59 |
| 10 to 19 units | 73 |
| 20 or more units | 102 |
| Mobile home | 34 |
| Boat, RV, van, etc. | 9 |
| Total housing units | 1,706 |
| Built 2014 or later | 0 |
| Built 2010 to 2013 | 29 |
| Built 2000 to 2009 | 276 |
| Built 1990 to 1999 | 271 |
| Built 1980 to 1989 | 614 |
| Built 1970 to 1979 | 408 |
| Built 1960 to 1969 | 37 |
| Built 1950 to 1959 | 14 |
| Built 1940 to 1949 | 48 |
| Built 1939 or earlier | 9 |
| Total housing units | 1,706 |
| 1 room | 14 |
| 2 rooms | 15 |
| 3 rooms | 171 |
| 4 rooms | 265 |
| 5 rooms | 292 |
| 6 rooms | 448 |
| 7 rooms | 148 |
| 8 rooms | 162 |
| 9 rooms or more | 191 |
| Median rooms | 5.7 |
| Total housing units | 1,706 |
| No bedroom | 14 |
| 1 bedroom | 191 |
| 2 bedrooms | 401 |
| 3 bedrooms | 669 |
| 4 bedrooms | 328 |
| 5 or more bedrooms | 103 |
| Occupied housing units | 1,594 |
| Owner-occupied | 1,172 |
| Renter-occupied | 422 |
| Average household size of owner-occupied unit | 2.95 |
| Average household size of renter-occupied unit | 2.39 |
| Occupied housing units | 1,594 |
| Moved in 2017 or later | 62 |
| Moved in 2015 to 2016 | 198 |
| Moved in 2010 to 2014 | 418 |
| Moved in 2000 to 2009 | 595 |
| Moved in 1990 to 1999 | 191 |
| Moved in 1989 and earlier | 130 |
| Owner-occupied units | 1,172 |
| Less than $50,000 | 23 |
| $50,000 to $99,999 | 8 |
| $100,000 to $149,999 | 8 |
| $150,000 to $199,999 | 8 |
| $200,000 to $299,999 | 40 |
| $300,000 to $499,999 | 212 |
| $500,000 to $999,999 | 629 |
| $1,000,000 or more | 244 |
| Median (dollars) | 690,800 |
| Owner-occupied units | 1,172 |
| Housing units with a mortgage | 844 |
| Housing units without a mortgage | 328 |
| Occupied units paying rent | 375 |
| Less than $500 | 0 |
| $500 to $999 | 64 |
| $1,000 to $1,499 | 78 |
| $1,500 to $1,999 | 111 |
| $2,000 to $2,499 | 90 |
| $2,500 to $2,999 | 32 |
| $3,000 or more | 0 |
| Median (dollars) | 1,705 |
| No rent paid | 47 |
Data is based on 2018 Census
ZIP Codes for other locations
State for BONSALL
California ZIP CodesOther cities in California