BURNEY, CA ZIP Code
| City | BURNEY |
| State | California |
| ZIP Codes count | 1 (see all) |
| Post offices count | 1 (see all) |
| Total population | 3,807 (see all) |
ZIP Code in BURNEY, California
96013
This list contains only 5-digit ZIP codes. Use our zip code lookup by address feature to get the full 9-digit (ZIP+4) code.
List of BURNEY, CA ZIP Codes
| ZIP | TYPE | POPU |
|---|---|---|
| 96013 | STANDARD | 4,519 |
Post offices
BURNEY — Post Office™ 20655 COMMERCE WAY BURNEY, CA 96013-9998 |
Envelope example
On the bottom center of the envelope, write the address you want your letter delivered to. Include the following on separate lines:
- Recipient's full name
- Full street address
- City, State, and ZIP Code
Using the same format, write the return address in the top left corner.
Using the full ZIP+4 Code when mailing via the USPS ensures the fastest, most accurate mailing possible. If you are not sure of the full 9-digit ZIP Code, use the 5-digit ZIP Code to avoid loss of letter or package.
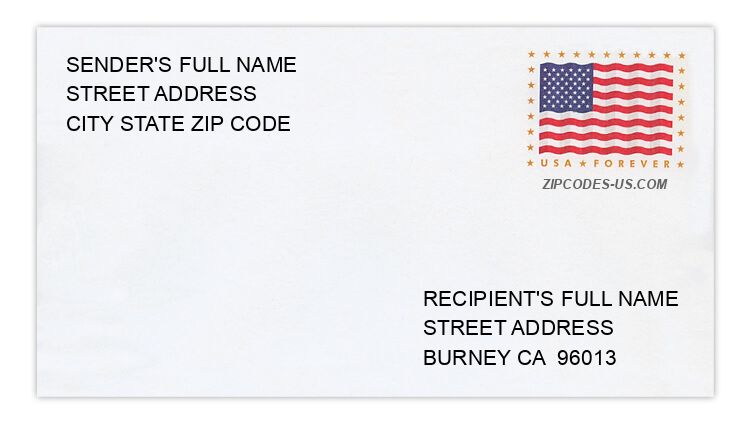
The recipient address information is provided for your reference.
Address example
21650 GARDEN LN
BURNEY CA 96013-9780
BURNEY CA 96013-9780
20506 MACKINAC ST
BURNEY CA 96013-4313
BURNEY CA 96013-4313
20445 MAPLE ST
BURNEY CA 96013-4117
BURNEY CA 96013-4117
21786 SHADOW LN
BURNEY CA 96013-9740
BURNEY CA 96013-9740
20039 TAMARACK RD
BURNEY CA 96013-4038
BURNEY CA 96013-4038
21626 VIOLA ST
BURNEY CA 96013-9750
BURNEY CA 96013-9750
Map
Hover over the map to see the ZIP code
Census data for BURNEY, CA
Demographic and housing estimates in BURNEY, CA
| Total population | 3,807 |
| Male | 1,852 |
| Female | 1,955 |
| Total population | 3,807 |
| Under 5 years | 363 |
| 5 to 9 years | 247 |
| 10 to 14 years | 339 |
| 15 to 19 years | 194 |
| 20 to 24 years | 147 |
| 25 to 34 years | 422 |
| 35 to 44 years | 359 |
| 45 to 54 years | 419 |
| 55 to 59 years | 281 |
| 60 to 64 years | 223 |
| 65 to 74 years | 547 |
| 75 to 84 years | 202 |
| 85 years and over | 64 |
| Median age (years) | 38.9 |
| Under 18 years | 1,052 |
| 16 years and over | 2,837 |
| 18 years and over | 2,755 |
| 21 years and over | 2,637 |
| 62 years and over | 972 |
| 65 years and over | 813 |
| Total population | 3,807 |
| One race | 3,771 |
| White | 3,342 |
| Black or African American | 30 |
| American Indian and Alaska Native | 181 |
| Asian | 89 |
| Native Hawaiian and Other Pacific Islander | 0 |
| Some other race | 129 |
| Two or more races | 36 |
| Citizen, VOTING AGE 18 and over population | 2,649 |
| Male Citizen, VOTING AGE 18 and over population | 1,150 |
| Female Citizen, VOTING AGE 18 and over population | 1,499 |
Social characteristics in BURNEY, CA
| Total households | 1,324 |
| Family households (families) | 888 |
| Married-couple family | 656 |
| Male householder, no wife present, family | 74 |
| Female householder, no husband present, family | 158 |
| Nonfamily households | 436 |
| Average household size | 2.76 |
| Average family size | 3.42 |
Economic characteristics in BURNEY, CA
| Total households | 1,324 |
| Less than $10,000 | 105 |
| $10,000 to $14,999 | 95 |
| $15,000 to $24,999 | 135 |
| $25,000 to $34,999 | 260 |
| $35,000 to $49,999 | 187 |
| $50,000 to $74,999 | 278 |
| $75,000 to $99,999 | 121 |
| $100,000 to $149,999 | 64 |
| $150,000 to $199,999 | 79 |
| $200,000 or more | 0 |
| Median household income (dollars) | 40,119 |
Housing characteristics in BURNEY, CA
| Total housing units | 1,542 |
| Occupied housing units | 1,324 |
| Vacant housing units | 218 |
| Total housing units | 1,542 |
| 1-unit, detached | 1,194 |
| 1-unit, attached | 34 |
| 2 units | 37 |
| 3 or 4 units | 98 |
| 5 to 9 units | 44 |
| 10 to 19 units | 39 |
| 20 or more units | 8 |
| Mobile home | 88 |
| Boat, RV, van, etc. | 0 |
| Total housing units | 1,542 |
| Built 2014 or later | 0 |
| Built 2010 to 2013 | 38 |
| Built 2000 to 2009 | 57 |
| Built 1990 to 1999 | 113 |
| Built 1980 to 1989 | 282 |
| Built 1970 to 1979 | 403 |
| Built 1960 to 1969 | 231 |
| Built 1950 to 1959 | 206 |
| Built 1940 to 1949 | 100 |
| Built 1939 or earlier | 112 |
| Total housing units | 1,542 |
| 1 room | 0 |
| 2 rooms | 30 |
| 3 rooms | 92 |
| 4 rooms | 359 |
| 5 rooms | 461 |
| 6 rooms | 296 |
| 7 rooms | 89 |
| 8 rooms | 111 |
| 9 rooms or more | 104 |
| Median rooms | 5.1 |
| Total housing units | 1,542 |
| No bedroom | 0 |
| 1 bedroom | 121 |
| 2 bedrooms | 426 |
| 3 bedrooms | 895 |
| 4 bedrooms | 51 |
| 5 or more bedrooms | 49 |
| Occupied housing units | 1,324 |
| Owner-occupied | 780 |
| Renter-occupied | 544 |
| Average household size of owner-occupied unit | 2.89 |
| Average household size of renter-occupied unit | 2.56 |
| Occupied housing units | 1,324 |
| Moved in 2017 or later | 67 |
| Moved in 2015 to 2016 | 163 |
| Moved in 2010 to 2014 | 464 |
| Moved in 2000 to 2009 | 289 |
| Moved in 1990 to 1999 | 118 |
| Moved in 1989 and earlier | 223 |
| Owner-occupied units | 780 |
| Less than $50,000 | 24 |
| $50,000 to $99,999 | 90 |
| $100,000 to $149,999 | 309 |
| $150,000 to $199,999 | 161 |
| $200,000 to $299,999 | 66 |
| $300,000 to $499,999 | 73 |
| $500,000 to $999,999 | 57 |
| $1,000,000 or more | 0 |
| Median (dollars) | 146,100 |
| Owner-occupied units | 780 |
| Housing units with a mortgage | 403 |
| Housing units without a mortgage | 377 |
| Occupied units paying rent | 486 |
| Less than $500 | 83 |
| $500 to $999 | 263 |
| $1,000 to $1,499 | 140 |
| $1,500 to $1,999 | 0 |
| $2,000 to $2,499 | 0 |
| $2,500 to $2,999 | 0 |
| $3,000 or more | 0 |
| Median (dollars) | 785 |
| No rent paid | 58 |
Data is based on 2018 Census
ZIP Codes for other locations
State for BURNEY
California ZIP CodesOther cities in California