CAMBRIA, CA ZIP Code
| City | CAMBRIA |
| State | California |
| ZIP Codes count | 1 (see all) |
| Post offices count | 1 (see all) |
| Total population | 5,725 (see all) |
ZIP Code in CAMBRIA, California
93428
This list contains only 5-digit ZIP codes. Use our zip code lookup by address feature to get the full 9-digit (ZIP+4) code.
List of CAMBRIA, CA ZIP Codes
| ZIP | TYPE | POPU |
|---|---|---|
| 93428 | STANDARD | 5,721 |
Post offices
CAMBRIA — Post Office™ 4100 BRIDGE ST CAMBRIA, CA 93428-9998 |
Envelope example
On the bottom center of the envelope, write the address you want your letter delivered to. Include the following on separate lines:
- Recipient's full name
- Full street address
- City, State, and ZIP Code
Using the same format, write the return address in the top left corner.
Using the full ZIP+4 Code when mailing via the USPS ensures the fastest, most accurate mailing possible. If you are not sure of the full 9-digit ZIP Code, use the 5-digit ZIP Code to avoid loss of letter or package.
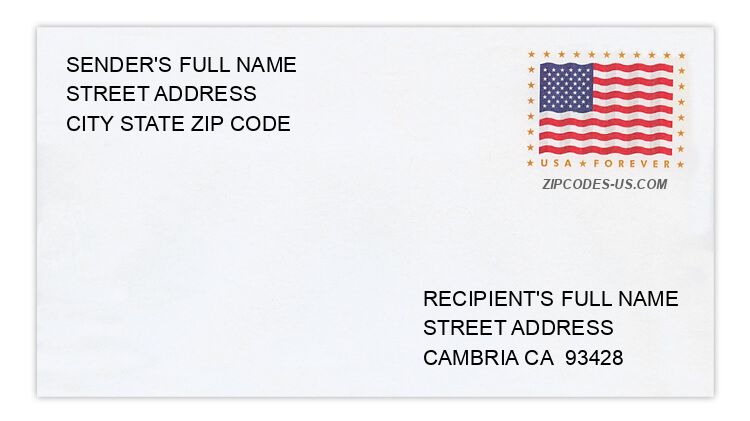
The recipient address information is provided for your reference.
Address example
2927 BERRY PATCH DR
CAMBRIA CA 93428-5537
CAMBRIA CA 93428-5537
9914 CAMINO DEL CAPITAN
CAMBRIA CA 93428-6020
CAMBRIA CA 93428-6020
1861 LAUREL PL
CAMBRIA CA 93428-5500
CAMBRIA CA 93428-5500
5587 OAKHURST DR
CAMBRIA CA 93428-2924
CAMBRIA CA 93428-2924
3146 PINE CT
CAMBRIA CA 93428-3920
CAMBRIA CA 93428-3920
3277 SAN SIMEON CREEK RD
CAMBRIA CA 93428-1826
CAMBRIA CA 93428-1826
Map
Hover over the map to see the ZIP code
Census data for CAMBRIA, CA
Demographic and housing estimates in CAMBRIA, CA
| Total population | 5,725 |
| Male | 2,677 |
| Female | 3,048 |
| Total population | 5,725 |
| Under 5 years | 154 |
| 5 to 9 years | 112 |
| 10 to 14 years | 202 |
| 15 to 19 years | 215 |
| 20 to 24 years | 162 |
| 25 to 34 years | 280 |
| 35 to 44 years | 356 |
| 45 to 54 years | 712 |
| 55 to 59 years | 466 |
| 60 to 64 years | 750 |
| 65 to 74 years | 1,467 |
| 75 to 84 years | 620 |
| 85 years and over | 229 |
| Median age (years) | 61.7 |
| Under 18 years | 568 |
| 16 years and over | 5,233 |
| 18 years and over | 5,157 |
| 21 years and over | 5,000 |
| 62 years and over | 2,816 |
| 65 years and over | 2,316 |
| Total population | 5,725 |
| One race | 5,626 |
| White | 5,076 |
| Black or African American | 24 |
| American Indian and Alaska Native | 12 |
| Asian | 173 |
| Native Hawaiian and Other Pacific Islander | 0 |
| Some other race | 341 |
| Two or more races | 99 |
| Citizen, VOTING AGE 18 and over population | 4,933 |
| Male Citizen, VOTING AGE 18 and over population | 2,342 |
| Female Citizen, VOTING AGE 18 and over population | 2,591 |
Social characteristics in CAMBRIA, CA
| Total households | 2,758 |
| Family households (families) | 1,709 |
| Married-couple family | 1,508 |
| Male householder, no wife present, family | 12 |
| Female householder, no husband present, family | 189 |
| Nonfamily households | 1,049 |
| Average household size | 2.07 |
| Average family size | 2.53 |
Economic characteristics in CAMBRIA, CA
| Total households | 2,758 |
| Less than $10,000 | 110 |
| $10,000 to $14,999 | 64 |
| $15,000 to $24,999 | 205 |
| $25,000 to $34,999 | 235 |
| $35,000 to $49,999 | 363 |
| $50,000 to $74,999 | 549 |
| $75,000 to $99,999 | 363 |
| $100,000 to $149,999 | 521 |
| $150,000 to $199,999 | 184 |
| $200,000 or more | 164 |
| Median household income (dollars) | 68,073 |
Housing characteristics in CAMBRIA, CA
| Total housing units | 4,196 |
| Occupied housing units | 2,758 |
| Vacant housing units | 1,438 |
| Total housing units | 4,196 |
| 1-unit, detached | 3,827 |
| 1-unit, attached | 90 |
| 2 units | 76 |
| 3 or 4 units | 44 |
| 5 to 9 units | 0 |
| 10 to 19 units | 12 |
| 20 or more units | 25 |
| Mobile home | 122 |
| Boat, RV, van, etc. | 0 |
| Total housing units | 4,196 |
| Built 2014 or later | 0 |
| Built 2010 to 2013 | 23 |
| Built 2000 to 2009 | 324 |
| Built 1990 to 1999 | 787 |
| Built 1980 to 1989 | 1,258 |
| Built 1970 to 1979 | 849 |
| Built 1960 to 1969 | 520 |
| Built 1950 to 1959 | 203 |
| Built 1940 to 1949 | 112 |
| Built 1939 or earlier | 120 |
| Total housing units | 4,196 |
| 1 room | 79 |
| 2 rooms | 84 |
| 3 rooms | 137 |
| 4 rooms | 694 |
| 5 rooms | 1,377 |
| 6 rooms | 832 |
| 7 rooms | 469 |
| 8 rooms | 306 |
| 9 rooms or more | 218 |
| Median rooms | 5.3 |
| Total housing units | 4,196 |
| No bedroom | 88 |
| 1 bedroom | 190 |
| 2 bedrooms | 1,508 |
| 3 bedrooms | 1,982 |
| 4 bedrooms | 289 |
| 5 or more bedrooms | 139 |
| Occupied housing units | 2,758 |
| Owner-occupied | 2,028 |
| Renter-occupied | 730 |
| Average household size of owner-occupied unit | 1.99 |
| Average household size of renter-occupied unit | 2.31 |
| Occupied housing units | 2,758 |
| Moved in 2017 or later | 74 |
| Moved in 2015 to 2016 | 237 |
| Moved in 2010 to 2014 | 788 |
| Moved in 2000 to 2009 | 860 |
| Moved in 1990 to 1999 | 578 |
| Moved in 1989 and earlier | 221 |
| Owner-occupied units | 2,028 |
| Less than $50,000 | 11 |
| $50,000 to $99,999 | 5 |
| $100,000 to $149,999 | 44 |
| $150,000 to $199,999 | 18 |
| $200,000 to $299,999 | 27 |
| $300,000 to $499,999 | 434 |
| $500,000 to $999,999 | 1,233 |
| $1,000,000 or more | 256 |
| Median (dollars) | 630,600 |
| Owner-occupied units | 2,028 |
| Housing units with a mortgage | 1,180 |
| Housing units without a mortgage | 848 |
| Occupied units paying rent | 725 |
| Less than $500 | 0 |
| $500 to $999 | 111 |
| $1,000 to $1,499 | 292 |
| $1,500 to $1,999 | 218 |
| $2,000 to $2,499 | 59 |
| $2,500 to $2,999 | 0 |
| $3,000 or more | 45 |
| Median (dollars) | 1,423 |
| No rent paid | 5 |
Data is based on 2018 Census
ZIP Codes for other locations
State for CAMBRIA
California ZIP CodesOther cities in California