DALY CITY, CA ZIP Code
| City | DALY CITY |
| State | California |
| ZIP Codes count | 4 (see all) |
| Post offices count | 4 (see all) |
| Total population | 106,638 (see all) |
ZIP Codes in DALY CITY, California
The ZIP Codes in DALY CITY, California fall within the range from 94014 to 94017. DALY CITY is covered by 4 ZIP Codes: 2 Standard and 2 PO Box. Below is the complete list:
94014, 94015, 94016, 94017
This list contains only 5-digit ZIP codes. Use our zip code lookup by address feature to get the full 9-digit (ZIP+4) code.
List of DALY CITY, CA ZIP Codes
| ZIP | TYPE | POPU |
|---|---|---|
| 94014 | STANDARD | 47,708 |
| 94015 | STANDARD | 64,754 |
| 94016 | PO BOX | – |
| 94017 | PO BOX | – |
Post offices
COLMA — Post Office™ 7373 MISSION ST DALY CITY, CA 94014-9991 |
DALY CITY — Post Office™ 1100 SULLIVAN AVE DALY CITY, CA 94015-9998 |
VISTA GRANDE — Post Office™ 6025 MISSION ST DALY CITY, CA 94014-9992 |
WESTLAKE — Post Office™ 199 SOUTHGATE AVE DALY CITY, CA 94015-9993 |
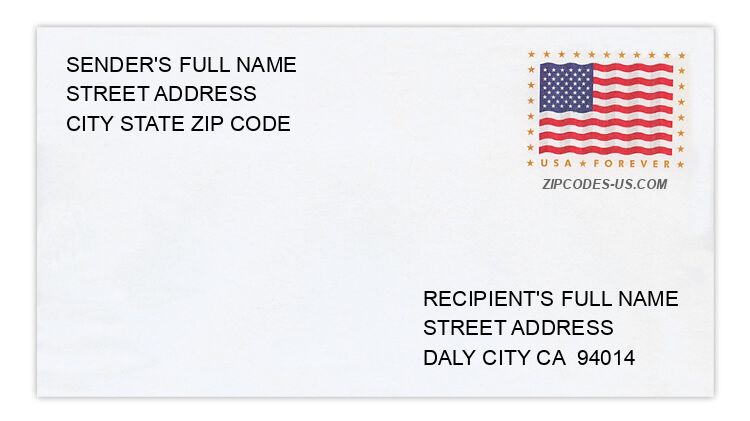
Envelope example
On the bottom center of the envelope, write the address you want your letter delivered to. Include the following on separate lines:
- Recipient's full name
- Full street address
- City, State, and ZIP Code
Using the same format, write the return address in the top left corner.
Using the full ZIP+4 Code when mailing via the USPS ensures the fastest, most accurate mailing possible. If you are not sure of the full 9-digit ZIP Code, use the 5-digit ZIP Code to avoid loss of letter or package.
The recipient address information is provided for your reference.
Address example
1373 DANBERRY LN
DALY CITY CA 94014-34ND
DALY CITY CA 94014-34ND
154 GLENWOOD AVE
DALY CITY CA 94015-3034
DALY CITY CA 94015-3034
49 HILLSDALE AVE
DALY CITY CA 94015-1011
DALY CITY CA 94015-1011
139 SERRAMONTE CTR
DALY CITY CA 94015-2349
DALY CITY CA 94015-2349
487 VERDUCCI DR
DALY CITY CA 94015-2843
DALY CITY CA 94015-2843
11 WESTON DR
DALY CITY CA 94015-3048
DALY CITY CA 94015-3048
Map
Hover over the map to see the ZIP code
Census data for DALY CITY, CA
Demographic and housing estimates in DALY CITY, CA
| Total population | 106,638 |
| Male | 52,701 |
| Female | 53,937 |
| Total population | 106,638 |
| Under 5 years | 4,659 |
| 5 to 9 years | 4,421 |
| 10 to 14 years | 4,758 |
| 15 to 19 years | 5,180 |
| 20 to 24 years | 8,541 |
| 25 to 34 years | 18,666 |
| 35 to 44 years | 14,133 |
| 45 to 54 years | 13,977 |
| 55 to 59 years | 7,401 |
| 60 to 64 years | 7,103 |
| 65 to 74 years | 9,950 |
| 75 to 84 years | 5,311 |
| 85 years and over | 2,538 |
| Median age (years) | 39.6 |
| Under 18 years | 16,909 |
| 16 years and over | 91,836 |
| 18 years and over | 89,729 |
| 21 years and over | 85,912 |
| 62 years and over | 21,865 |
| 65 years and over | 17,799 |
| Total population | 106,638 |
| One race | 101,649 |
| White | 23,228 |
| Black or African American | 3,442 |
| American Indian and Alaska Native | 399 |
| Asian | 60,739 |
| Native Hawaiian and Other Pacific Islander | 1,166 |
| Some other race | 12,675 |
| Two or more races | 4,989 |
| Citizen, VOTING AGE 18 and over population | 72,095 |
| Male Citizen, VOTING AGE 18 and over population | 34,705 |
| Female Citizen, VOTING AGE 18 and over population | 37,390 |
Social characteristics in DALY CITY, CA
| Total households | 31,620 |
| Family households (families) | 23,168 |
| Married-couple family | 15,922 |
| Male householder, no wife present, family | 2,667 |
| Female householder, no husband present, family | 4,579 |
| Nonfamily households | 8,452 |
| Average household size | 3.35 |
| Average family size | 3.75 |
Economic characteristics in DALY CITY, CA
| Total households | 31,620 |
| Less than $10,000 | 1,014 |
| $10,000 to $14,999 | 961 |
| $15,000 to $24,999 | 1,693 |
| $25,000 to $34,999 | 1,839 |
| $35,000 to $49,999 | 2,421 |
| $50,000 to $74,999 | 4,980 |
| $75,000 to $99,999 | 4,640 |
| $100,000 to $149,999 | 6,576 |
| $150,000 to $199,999 | 3,749 |
| $200,000 or more | 3,747 |
| Median household income (dollars) | 90,335 |
Housing characteristics in DALY CITY, CA
| Total housing units | 32,765 |
| Occupied housing units | 31,620 |
| Vacant housing units | 1,145 |
| Total housing units | 32,765 |
| 1-unit, detached | 15,313 |
| 1-unit, attached | 4,947 |
| 2 units | 1,972 |
| 3 or 4 units | 1,958 |
| 5 to 9 units | 1,369 |
| 10 to 19 units | 1,729 |
| 20 or more units | 4,953 |
| Mobile home | 496 |
| Boat, RV, van, etc. | 28 |
| Total housing units | 32,765 |
| Built 2014 or later | 41 |
| Built 2010 to 2013 | 300 |
| Built 2000 to 2009 | 1,110 |
| Built 1990 to 1999 | 2,693 |
| Built 1980 to 1989 | 3,365 |
| Built 1970 to 1979 | 6,891 |
| Built 1960 to 1969 | 5,596 |
| Built 1950 to 1959 | 7,577 |
| Built 1940 to 1949 | 2,742 |
| Built 1939 or earlier | 2,450 |
| Total housing units | 32,765 |
| 1 room | 1,922 |
| 2 rooms | 2,099 |
| 3 rooms | 4,308 |
| 4 rooms | 6,024 |
| 5 rooms | 7,320 |
| 6 rooms | 5,083 |
| 7 rooms | 3,173 |
| 8 rooms | 1,743 |
| 9 rooms or more | 1,093 |
| Median rooms | 4.8 |
| Total housing units | 32,765 |
| No bedroom | 2,063 |
| 1 bedroom | 4,988 |
| 2 bedrooms | 8,046 |
| 3 bedrooms | 11,098 |
| 4 bedrooms | 5,137 |
| 5 or more bedrooms | 1,433 |
| Occupied housing units | 31,620 |
| Owner-occupied | 18,054 |
| Renter-occupied | 13,566 |
| Average household size of owner-occupied unit | 3.40 |
| Average household size of renter-occupied unit | 3.27 |
| Occupied housing units | 31,620 |
| Moved in 2017 or later | 1,288 |
| Moved in 2015 to 2016 | 2,838 |
| Moved in 2010 to 2014 | 8,358 |
| Moved in 2000 to 2009 | 7,731 |
| Moved in 1990 to 1999 | 4,305 |
| Moved in 1989 and earlier | 7,100 |
| Owner-occupied units | 18,054 |
| Less than $50,000 | 133 |
| $50,000 to $99,999 | 209 |
| $100,000 to $149,999 | 258 |
| $150,000 to $199,999 | 112 |
| $200,000 to $299,999 | 318 |
| $300,000 to $499,999 | 1,827 |
| $500,000 to $999,999 | 13,484 |
| $1,000,000 or more | 1,713 |
| Median (dollars) | 711,800 |
| Owner-occupied units | 18,054 |
| Housing units with a mortgage | 12,286 |
| Housing units without a mortgage | 5,768 |
| Occupied units paying rent | 13,050 |
| Less than $500 | 325 |
| $500 to $999 | 662 |
| $1,000 to $1,499 | 1,518 |
| $1,500 to $1,999 | 3,468 |
| $2,000 to $2,499 | 3,698 |
| $2,500 to $2,999 | 1,608 |
| $3,000 or more | 1,771 |
| Median (dollars) | 2,075 |
| No rent paid | 516 |
Data is based on 2018 Census
ZIP Codes for other locations
State for DALY CITY
California ZIP CodesOther cities in California