EL GRANADA, CA ZIP Code
| City | EL GRANADA |
| State | California |
| ZIP Codes count | 1 (see all) |
| Post offices count | 1 (see all) |
| Total population | 5,819 (see all) |
ZIP Code in EL GRANADA, California
94018
This list contains only 5-digit ZIP codes. Use our zip code lookup by address feature to get the full 9-digit (ZIP+4) code.
List of EL GRANADA, CA ZIP Codes
| ZIP | TYPE | POPU |
|---|---|---|
| 94018 | PO BOX | – |
Post offices
EL GRANADA — Post Office™ 20 AVENUE PORTOLA EL GRANADA, CA 94018-9998 |
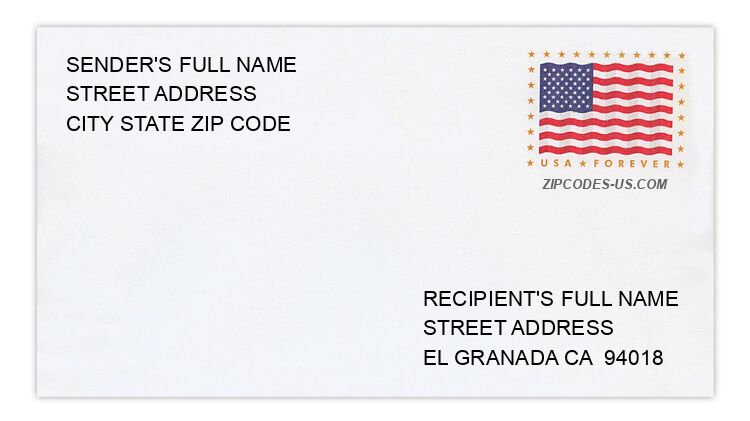
Envelope example
On the bottom center of the envelope, write the address you want your letter delivered to. Include the following on separate lines:
- Recipient's full name
- Full street address
- City, State, and ZIP Code
Using the same format, write the return address in the top left corner.
Using the full ZIP+4 Code when mailing via the USPS ensures the fastest, most accurate mailing possible. If you are not sure of the full 9-digit ZIP Code, use the 5-digit ZIP Code to avoid loss of letter or package.
The recipient address information is provided for your reference.
Address example
542 ALMERIA AVE
EL GRANADA CA 94018-8047
EL GRANADA CA 94018-8047
285 AVE CABRILLO
EL GRANADA CA 94018-8202
EL GRANADA CA 94018-8202
101 LEWIS AVE
EL GRANADA CA 94018-8109
EL GRANADA CA 94018-8109
248 ROYALPALM AVE
EL GRANADA CA 94018-8193
EL GRANADA CA 94018-8193
678 SAN CARLOS AVE
EL GRANADA CA 94018-8050
EL GRANADA CA 94018-8050
444 SONORA AVE
EL GRANADA CA 94018-8042
EL GRANADA CA 94018-8042
Map
Hover over the map to see the ZIP code
Census data for EL GRANADA, CA
Demographic and housing estimates in EL GRANADA, CA
| Total population | 5,819 |
| Male | 2,926 |
| Female | 2,893 |
| Total population | 5,819 |
| Under 5 years | 251 |
| 5 to 9 years | 413 |
| 10 to 14 years | 367 |
| 15 to 19 years | 355 |
| 20 to 24 years | 155 |
| 25 to 34 years | 445 |
| 35 to 44 years | 731 |
| 45 to 54 years | 1,170 |
| 55 to 59 years | 411 |
| 60 to 64 years | 881 |
| 65 to 74 years | 479 |
| 75 to 84 years | 138 |
| 85 years and over | 23 |
| Median age (years) | 46.7 |
| Under 18 years | 1,242 |
| 16 years and over | 4,771 |
| 18 years and over | 4,577 |
| 21 years and over | 4,397 |
| 62 years and over | 1,268 |
| 65 years and over | 640 |
| Total population | 5,819 |
| One race | 5,684 |
| White | 4,475 |
| Black or African American | 0 |
| American Indian and Alaska Native | 0 |
| Asian | 331 |
| Native Hawaiian and Other Pacific Islander | 2 |
| Some other race | 876 |
| Two or more races | 135 |
| Citizen, VOTING AGE 18 and over population | 4,276 |
| Male Citizen, VOTING AGE 18 and over population | 1,987 |
| Female Citizen, VOTING AGE 18 and over population | 2,289 |
Social characteristics in EL GRANADA, CA
| Total households | 2,119 |
| Family households (families) | 1,622 |
| Married-couple family | 1,372 |
| Male householder, no wife present, family | 51 |
| Female householder, no husband present, family | 199 |
| Nonfamily households | 497 |
| Average household size | 2.74 |
| Average family size | 3.11 |
Economic characteristics in EL GRANADA, CA
| Total households | 2,119 |
| Less than $10,000 | 0 |
| $10,000 to $14,999 | 0 |
| $15,000 to $24,999 | 34 |
| $25,000 to $34,999 | 16 |
| $35,000 to $49,999 | 165 |
| $50,000 to $74,999 | 323 |
| $75,000 to $99,999 | 266 |
| $100,000 to $149,999 | 339 |
| $150,000 to $199,999 | 411 |
| $200,000 or more | 565 |
| Median household income (dollars) | 143,494 |
Housing characteristics in EL GRANADA, CA
| Total housing units | 2,212 |
| Occupied housing units | 2,119 |
| Vacant housing units | 93 |
| Total housing units | 2,212 |
| 1-unit, detached | 1,859 |
| 1-unit, attached | 80 |
| 2 units | 77 |
| 3 or 4 units | 69 |
| 5 to 9 units | 105 |
| 10 to 19 units | 0 |
| 20 or more units | 22 |
| Mobile home | 0 |
| Boat, RV, van, etc. | 0 |
| Total housing units | 2,212 |
| Built 2014 or later | 9 |
| Built 2010 to 2013 | 0 |
| Built 2000 to 2009 | 396 |
| Built 1990 to 1999 | 279 |
| Built 1980 to 1989 | 336 |
| Built 1970 to 1979 | 514 |
| Built 1960 to 1969 | 247 |
| Built 1950 to 1959 | 337 |
| Built 1940 to 1949 | 12 |
| Built 1939 or earlier | 82 |
| Total housing units | 2,212 |
| 1 room | 26 |
| 2 rooms | 22 |
| 3 rooms | 0 |
| 4 rooms | 364 |
| 5 rooms | 527 |
| 6 rooms | 506 |
| 7 rooms | 299 |
| 8 rooms | 186 |
| 9 rooms or more | 282 |
| Median rooms | 5.8 |
| Total housing units | 2,212 |
| No bedroom | 26 |
| 1 bedroom | 22 |
| 2 bedrooms | 344 |
| 3 bedrooms | 1,169 |
| 4 bedrooms | 544 |
| 5 or more bedrooms | 107 |
| Occupied housing units | 2,119 |
| Owner-occupied | 1,763 |
| Renter-occupied | 356 |
| Average household size of owner-occupied unit | 2.73 |
| Average household size of renter-occupied unit | 2.75 |
| Occupied housing units | 2,119 |
| Moved in 2017 or later | 35 |
| Moved in 2015 to 2016 | 95 |
| Moved in 2010 to 2014 | 445 |
| Moved in 2000 to 2009 | 868 |
| Moved in 1990 to 1999 | 281 |
| Moved in 1989 and earlier | 395 |
| Owner-occupied units | 1,763 |
| Less than $50,000 | 102 |
| $50,000 to $99,999 | 0 |
| $100,000 to $149,999 | 0 |
| $150,000 to $199,999 | 0 |
| $200,000 to $299,999 | 17 |
| $300,000 to $499,999 | 0 |
| $500,000 to $999,999 | 803 |
| $1,000,000 or more | 841 |
| Median (dollars) | 981,400 |
| Owner-occupied units | 1,763 |
| Housing units with a mortgage | 1,462 |
| Housing units without a mortgage | 301 |
| Occupied units paying rent | 356 |
| Less than $500 | 0 |
| $500 to $999 | 0 |
| $1,000 to $1,499 | 22 |
| $1,500 to $1,999 | 166 |
| $2,000 to $2,499 | 17 |
| $2,500 to $2,999 | 68 |
| $3,000 or more | 83 |
| Median (dollars) | 1,970 |
| No rent paid | 0 |
Data is based on 2018 Census
ZIP Codes for other locations
State for EL GRANADA
California ZIP CodesOther cities in California