GROVER BEACH, CA ZIP Code
| City | GROVER BEACH |
| State | California |
| ZIP Codes count | 2 (see all) |
| Post offices count | 2 (see all) |
| Total population | 13,538 (see all) |
ZIP Codes in GROVER BEACH, California
93433, 93483
This list contains only 5-digit ZIP codes. Use our zip code lookup by address feature to get the full 9-digit (ZIP+4) code.
List of GROVER BEACH, CA ZIP Codes
| ZIP | TYPE | POPU |
|---|---|---|
| 93433 | STANDARD | 12,846 |
| 93483 | PO BOX | – |
Post offices
GROVER BEACH — Post Office™ 917 W GRAND AVE GROVER BEACH, CA 93433-9998 |
PISMO BEACH — Post Office™ 100 CREST DR PISMO BEACH, CA 93449-9998 |
Envelope example
On the bottom center of the envelope, write the address you want your letter delivered to. Include the following on separate lines:
- Recipient's full name
- Full street address
- City, State, and ZIP Code
Using the same format, write the return address in the top left corner.
Using the full ZIP+4 Code when mailing via the USPS ensures the fastest, most accurate mailing possible. If you are not sure of the full 9-digit ZIP Code, use the 5-digit ZIP Code to avoid loss of letter or package.
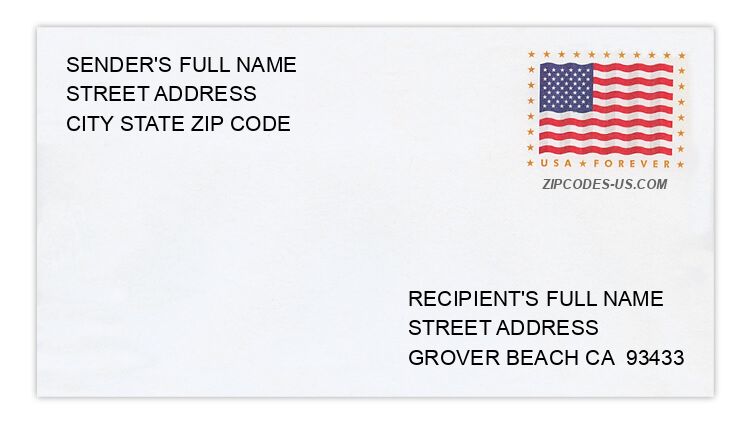
The recipient address information is provided for your reference.
Address example
238 ANITA AVE
GROVER BEACH CA 93433-3204
GROVER BEACH CA 93433-3204
373 N 10TH ST
GROVER BEACH CA 93433-1743
GROVER BEACH CA 93433-1743
867 PACIFICA DR
GROVER BEACH CA 93433-1352
GROVER BEACH CA 93433-1352
510 PARK VIEW AVE
GROVER BEACH CA 93433-1334
GROVER BEACH CA 93433-1334
1013 PEBBLE ST
GROVER BEACH CA 93433-3247
GROVER BEACH CA 93433-3247
357 STINSON CT
GROVER BEACH CA 93433-2589
GROVER BEACH CA 93433-2589
Map
Hover over the map to see the ZIP code
Census data for GROVER BEACH, CA
Demographic and housing estimates in GROVER BEACH, CA
| Total population | 13,538 |
| Male | 6,682 |
| Female | 6,856 |
| Total population | 13,538 |
| Under 5 years | 1,225 |
| 5 to 9 years | 1,017 |
| 10 to 14 years | 700 |
| 15 to 19 years | 701 |
| 20 to 24 years | 823 |
| 25 to 34 years | 2,192 |
| 35 to 44 years | 1,649 |
| 45 to 54 years | 1,523 |
| 55 to 59 years | 988 |
| 60 to 64 years | 753 |
| 65 to 74 years | 1,059 |
| 75 to 84 years | 596 |
| 85 years and over | 312 |
| Median age (years) | 36.2 |
| Under 18 years | 3,448 |
| 16 years and over | 10,505 |
| 18 years and over | 10,090 |
| 21 years and over | 9,867 |
| 62 years and over | 2,485 |
| 65 years and over | 1,967 |
| Total population | 13,538 |
| One race | 12,963 |
| White | 10,784 |
| Black or African American | 376 |
| American Indian and Alaska Native | 128 |
| Asian | 566 |
| Native Hawaiian and Other Pacific Islander | 68 |
| Some other race | 1,041 |
| Two or more races | 575 |
| Citizen, VOTING AGE 18 and over population | 9,440 |
| Male Citizen, VOTING AGE 18 and over population | 4,534 |
| Female Citizen, VOTING AGE 18 and over population | 4,906 |
Social characteristics in GROVER BEACH, CA
| Total households | 5,216 |
| Family households (families) | 3,356 |
| Married-couple family | 2,071 |
| Male householder, no wife present, family | 515 |
| Female householder, no husband present, family | 770 |
| Nonfamily households | 1,860 |
| Average household size | 2.59 |
| Average family size | 3.12 |
Economic characteristics in GROVER BEACH, CA
| Total households | 5,216 |
| Less than $10,000 | 191 |
| $10,000 to $14,999 | 220 |
| $15,000 to $24,999 | 404 |
| $25,000 to $34,999 | 374 |
| $35,000 to $49,999 | 630 |
| $50,000 to $74,999 | 1,161 |
| $75,000 to $99,999 | 822 |
| $100,000 to $149,999 | 918 |
| $150,000 to $199,999 | 229 |
| $200,000 or more | 267 |
| Median household income (dollars) | 68,333 |
Housing characteristics in GROVER BEACH, CA
| Total housing units | 5,748 |
| Occupied housing units | 5,216 |
| Vacant housing units | 532 |
| Total housing units | 5,748 |
| 1-unit, detached | 3,122 |
| 1-unit, attached | 574 |
| 2 units | 359 |
| 3 or 4 units | 821 |
| 5 to 9 units | 315 |
| 10 to 19 units | 187 |
| 20 or more units | 186 |
| Mobile home | 184 |
| Boat, RV, van, etc. | 0 |
| Total housing units | 5,748 |
| Built 2014 or later | 14 |
| Built 2010 to 2013 | 65 |
| Built 2000 to 2009 | 409 |
| Built 1990 to 1999 | 719 |
| Built 1980 to 1989 | 1,126 |
| Built 1970 to 1979 | 1,545 |
| Built 1960 to 1969 | 524 |
| Built 1950 to 1959 | 915 |
| Built 1940 to 1949 | 224 |
| Built 1939 or earlier | 207 |
| Total housing units | 5,748 |
| 1 room | 86 |
| 2 rooms | 92 |
| 3 rooms | 987 |
| 4 rooms | 1,679 |
| 5 rooms | 1,242 |
| 6 rooms | 961 |
| 7 rooms | 287 |
| 8 rooms | 227 |
| 9 rooms or more | 187 |
| Median rooms | 4.5 |
| Total housing units | 5,748 |
| No bedroom | 105 |
| 1 bedroom | 624 |
| 2 bedrooms | 2,767 |
| 3 bedrooms | 1,844 |
| 4 bedrooms | 376 |
| 5 or more bedrooms | 32 |
| Occupied housing units | 5,216 |
| Owner-occupied | 2,366 |
| Renter-occupied | 2,850 |
| Average household size of owner-occupied unit | 2.45 |
| Average household size of renter-occupied unit | 2.71 |
| Occupied housing units | 5,216 |
| Moved in 2017 or later | 406 |
| Moved in 2015 to 2016 | 652 |
| Moved in 2010 to 2014 | 1,760 |
| Moved in 2000 to 2009 | 1,312 |
| Moved in 1990 to 1999 | 695 |
| Moved in 1989 and earlier | 391 |
| Owner-occupied units | 2,366 |
| Less than $50,000 | 70 |
| $50,000 to $99,999 | 73 |
| $100,000 to $149,999 | 16 |
| $150,000 to $199,999 | 0 |
| $200,000 to $299,999 | 88 |
| $300,000 to $499,999 | 1,199 |
| $500,000 to $999,999 | 853 |
| $1,000,000 or more | 67 |
| Median (dollars) | 464,000 |
| Owner-occupied units | 2,366 |
| Housing units with a mortgage | 1,544 |
| Housing units without a mortgage | 822 |
| Occupied units paying rent | 2,804 |
| Less than $500 | 15 |
| $500 to $999 | 439 |
| $1,000 to $1,499 | 1,351 |
| $1,500 to $1,999 | 863 |
| $2,000 to $2,499 | 106 |
| $2,500 to $2,999 | 30 |
| $3,000 or more | 0 |
| Median (dollars) | 1,328 |
| No rent paid | 46 |
Data is based on 2018 Census
ZIP Codes for other locations
State for GROVER BEACH
California ZIP CodesOther cities in California