HANFORD, CA ZIP Code
| City | HANFORD |
| State | California |
| ZIP Codes count | 2 (see all) |
| Post offices count | 1 (see all) |
| Total population | 55,893 (see all) |
ZIP Codes in HANFORD, California
93230, 93232
This list contains only 5-digit ZIP codes. Use our zip code lookup by address feature to get the full 9-digit (ZIP+4) code.
List of HANFORD, CA ZIP Codes
| ZIP | TYPE | POPU |
|---|---|---|
| 93230 | STANDARD | 67,486 |
| 93232 | PO BOX | – |
Post offices
HANFORD — Post Office™ 517 N IRWIN ST HANFORD, CA 93230-9998 |
Envelope example
On the bottom center of the envelope, write the address you want your letter delivered to. Include the following on separate lines:
- Recipient's full name
- Full street address
- City, State, and ZIP Code
Using the same format, write the return address in the top left corner.
Using the full ZIP+4 Code when mailing via the USPS ensures the fastest, most accurate mailing possible. If you are not sure of the full 9-digit ZIP Code, use the 5-digit ZIP Code to avoid loss of letter or package.
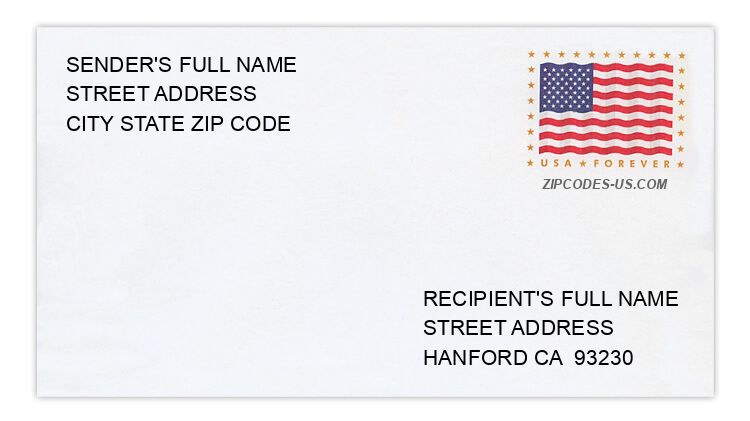
The recipient address information is provided for your reference.
Address example
384 BRADEN AVE
HANFORD CA 93230-5304
HANFORD CA 93230-5304
1291 DELTA VIEW RD
HANFORD CA 93230-9312
HANFORD CA 93230-9312
1034 DRIFTWOOD CT
HANFORD CA 93230-7218
HANFORD CA 93230-7218
2494 N RIESLING AVE
HANFORD CA 93230-8173
HANFORD CA 93230-8173
1314 VICTORY CT
HANFORD CA 93230-1988
HANFORD CA 93230-1988
1448 WHITMORE ST
HANFORD CA 93230-2832
HANFORD CA 93230-2832
Map
Hover over the map to see the ZIP code
Census data for HANFORD, CA
Demographic and housing estimates in HANFORD, CA
| Total population | 55,893 |
| Male | 28,421 |
| Female | 27,472 |
| Total population | 55,893 |
| Under 5 years | 4,492 |
| 5 to 9 years | 4,592 |
| 10 to 14 years | 4,090 |
| 15 to 19 years | 3,911 |
| 20 to 24 years | 3,833 |
| 25 to 34 years | 8,762 |
| 35 to 44 years | 6,983 |
| 45 to 54 years | 6,843 |
| 55 to 59 years | 3,026 |
| 60 to 64 years | 2,862 |
| 65 to 74 years | 3,698 |
| 75 to 84 years | 2,087 |
| 85 years and over | 714 |
| Median age (years) | 32.9 |
| Under 18 years | 15,759 |
| 16 years and over | 41,913 |
| 18 years and over | 40,134 |
| 21 years and over | 38,051 |
| 62 years and over | 7,850 |
| 65 years and over | 6,499 |
| Total population | 55,893 |
| One race | 53,254 |
| White | 41,241 |
| Black or African American | 2,933 |
| American Indian and Alaska Native | 378 |
| Asian | 2,869 |
| Native Hawaiian and Other Pacific Islander | 175 |
| Some other race | 5,658 |
| Two or more races | 2,639 |
| Citizen, VOTING AGE 18 and over population | 35,478 |
| Male Citizen, VOTING AGE 18 and over population | 17,911 |
| Female Citizen, VOTING AGE 18 and over population | 17,567 |
Social characteristics in HANFORD, CA
| Total households | 18,295 |
| Family households (families) | 13,627 |
| Married-couple family | 9,264 |
| Male householder, no wife present, family | 1,177 |
| Female householder, no husband present, family | 3,186 |
| Nonfamily households | 4,668 |
| Average household size | 3.03 |
| Average family size | 3.46 |
Economic characteristics in HANFORD, CA
| Total households | 18,295 |
| Less than $10,000 | 919 |
| $10,000 to $14,999 | 985 |
| $15,000 to $24,999 | 1,371 |
| $25,000 to $34,999 | 1,997 |
| $35,000 to $49,999 | 2,449 |
| $50,000 to $74,999 | 3,139 |
| $75,000 to $99,999 | 2,792 |
| $100,000 to $149,999 | 2,889 |
| $150,000 to $199,999 | 970 |
| $200,000 or more | 784 |
| Median household income (dollars) | 61,647 |
Housing characteristics in HANFORD, CA
| Total housing units | 19,397 |
| Occupied housing units | 18,295 |
| Vacant housing units | 1,102 |
| Total housing units | 19,397 |
| 1-unit, detached | 14,408 |
| 1-unit, attached | 222 |
| 2 units | 854 |
| 3 or 4 units | 1,221 |
| 5 to 9 units | 805 |
| 10 to 19 units | 341 |
| 20 or more units | 1,112 |
| Mobile home | 434 |
| Boat, RV, van, etc. | 0 |
| Total housing units | 19,397 |
| Built 2014 or later | 359 |
| Built 2010 to 2013 | 396 |
| Built 2000 to 2009 | 3,415 |
| Built 1990 to 1999 | 3,616 |
| Built 1980 to 1989 | 3,180 |
| Built 1970 to 1979 | 2,672 |
| Built 1960 to 1969 | 1,898 |
| Built 1950 to 1959 | 1,755 |
| Built 1940 to 1949 | 968 |
| Built 1939 or earlier | 1,138 |
| Total housing units | 19,397 |
| 1 room | 465 |
| 2 rooms | 391 |
| 3 rooms | 1,093 |
| 4 rooms | 3,488 |
| 5 rooms | 5,070 |
| 6 rooms | 4,584 |
| 7 rooms | 2,082 |
| 8 rooms | 1,301 |
| 9 rooms or more | 923 |
| Median rooms | 5.3 |
| Total housing units | 19,397 |
| No bedroom | 465 |
| 1 bedroom | 1,246 |
| 2 bedrooms | 4,046 |
| 3 bedrooms | 9,917 |
| 4 bedrooms | 3,182 |
| 5 or more bedrooms | 541 |
| Occupied housing units | 18,295 |
| Owner-occupied | 10,487 |
| Renter-occupied | 7,808 |
| Average household size of owner-occupied unit | 2.96 |
| Average household size of renter-occupied unit | 3.12 |
| Occupied housing units | 18,295 |
| Moved in 2017 or later | 1,256 |
| Moved in 2015 to 2016 | 2,432 |
| Moved in 2010 to 2014 | 6,460 |
| Moved in 2000 to 2009 | 4,236 |
| Moved in 1990 to 1999 | 2,026 |
| Moved in 1989 and earlier | 1,885 |
| Owner-occupied units | 10,487 |
| Less than $50,000 | 514 |
| $50,000 to $99,999 | 579 |
| $100,000 to $149,999 | 1,347 |
| $150,000 to $199,999 | 2,218 |
| $200,000 to $299,999 | 4,085 |
| $300,000 to $499,999 | 1,338 |
| $500,000 to $999,999 | 350 |
| $1,000,000 or more | 56 |
| Median (dollars) | 211,900 |
| Owner-occupied units | 10,487 |
| Housing units with a mortgage | 7,734 |
| Housing units without a mortgage | 2,753 |
| Occupied units paying rent | 7,533 |
| Less than $500 | 610 |
| $500 to $999 | 3,225 |
| $1,000 to $1,499 | 2,673 |
| $1,500 to $1,999 | 857 |
| $2,000 to $2,499 | 83 |
| $2,500 to $2,999 | 30 |
| $3,000 or more | 55 |
| Median (dollars) | 990 |
| No rent paid | 275 |
Data is based on 2018 Census
ZIP Codes for other locations
State for HANFORD
California ZIP CodesOther cities in California