HAYFORK, CA ZIP Code
| City | HAYFORK |
| State | California |
| ZIP Codes count | 1 (see all) |
| Post offices count | 1 (see all) |
| Total population | 2,421 (see all) |
ZIP Code in HAYFORK, California
96041
This list contains only 5-digit ZIP codes. Use our zip code lookup by address feature to get the full 9-digit (ZIP+4) code.
List of HAYFORK, CA ZIP Codes
| ZIP | TYPE | POPU |
|---|---|---|
| 96041 | STANDARD | 3,873 |
Post offices
HAYFORK — Post Office™ 7180 STATE HIGHWAY 3 HAYFORK, CA 96041-9997 |
Envelope example
On the bottom center of the envelope, write the address you want your letter delivered to. Include the following on separate lines:
- Recipient's full name
- Full street address
- City, State, and ZIP Code
Using the same format, write the return address in the top left corner.
Using the full ZIP+4 Code when mailing via the USPS ensures the fastest, most accurate mailing possible. If you are not sure of the full 9-digit ZIP Code, use the 5-digit ZIP Code to avoid loss of letter or package.
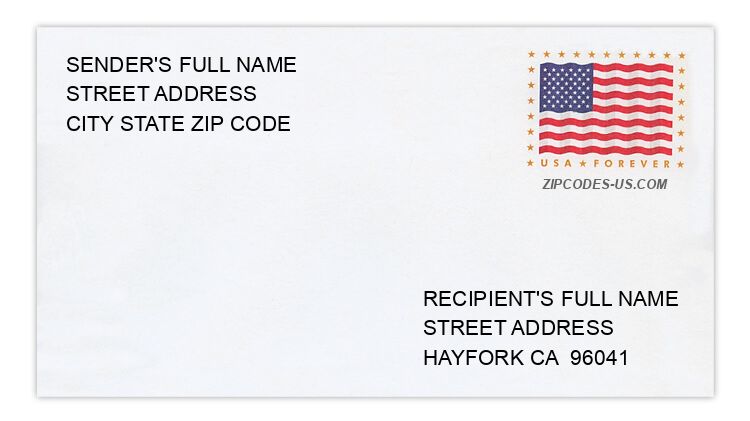
The recipient address information is provided for your reference.
Address example
91 ASH AVE
HAYFORK CA 96041-9003
HAYFORK CA 96041-9003
61 GENEST ST
HAYFORK CA 96041-9019
HAYFORK CA 96041-9019
340 NELSON RD
HAYFORK CA 96041-9035
HAYFORK CA 96041-9035
52 PINE AVE
HAYFORK CA 96041-9037
HAYFORK CA 96041-9037
259 ROCKY RD
HAYFORK CA 96041-9039
HAYFORK CA 96041-9039
65 SUNSHINE MEADOW WAY
HAYFORK CA 96041-9051
HAYFORK CA 96041-9051
Map
Hover over the map to see the ZIP code
Census data for HAYFORK, CA
Demographic and housing estimates in HAYFORK, CA
| Total population | 2,421 |
| Male | 1,138 |
| Female | 1,283 |
| Total population | 2,421 |
| Under 5 years | 110 |
| 5 to 9 years | 94 |
| 10 to 14 years | 71 |
| 15 to 19 years | 165 |
| 20 to 24 years | 142 |
| 25 to 34 years | 175 |
| 35 to 44 years | 322 |
| 45 to 54 years | 261 |
| 55 to 59 years | 195 |
| 60 to 64 years | 235 |
| 65 to 74 years | 323 |
| 75 to 84 years | 255 |
| 85 years and over | 73 |
| Median age (years) | 51.2 |
| Under 18 years | 342 |
| 16 years and over | 2,146 |
| 18 years and over | 2,079 |
| 21 years and over | 1,981 |
| 62 years and over | 802 |
| 65 years and over | 651 |
| Total population | 2,421 |
| One race | 2,382 |
| White | 1,959 |
| Black or African American | 20 |
| American Indian and Alaska Native | 75 |
| Asian | 57 |
| Native Hawaiian and Other Pacific Islander | 0 |
| Some other race | 271 |
| Two or more races | 39 |
| Citizen, VOTING AGE 18 and over population | 1,876 |
| Male Citizen, VOTING AGE 18 and over population | 876 |
| Female Citizen, VOTING AGE 18 and over population | 1,000 |
Social characteristics in HAYFORK, CA
| Total households | 1,048 |
| Family households (families) | 712 |
| Married-couple family | 516 |
| Male householder, no wife present, family | 45 |
| Female householder, no husband present, family | 151 |
| Nonfamily households | 336 |
| Average household size | 2.29 |
| Average family size | 2.76 |
Economic characteristics in HAYFORK, CA
| Total households | 1,048 |
| Less than $10,000 | 74 |
| $10,000 to $14,999 | 148 |
| $15,000 to $24,999 | 160 |
| $25,000 to $34,999 | 208 |
| $35,000 to $49,999 | 89 |
| $50,000 to $74,999 | 118 |
| $75,000 to $99,999 | 106 |
| $100,000 to $149,999 | 85 |
| $150,000 to $199,999 | 33 |
| $200,000 or more | 27 |
| Median household income (dollars) | 31,667 |
Housing characteristics in HAYFORK, CA
| Total housing units | 1,260 |
| Occupied housing units | 1,048 |
| Vacant housing units | 212 |
| Total housing units | 1,260 |
| 1-unit, detached | 860 |
| 1-unit, attached | 0 |
| 2 units | 0 |
| 3 or 4 units | 23 |
| 5 to 9 units | 54 |
| 10 to 19 units | 0 |
| 20 or more units | 0 |
| Mobile home | 323 |
| Boat, RV, van, etc. | 0 |
| Total housing units | 1,260 |
| Built 2014 or later | 0 |
| Built 2010 to 2013 | 0 |
| Built 2000 to 2009 | 286 |
| Built 1990 to 1999 | 57 |
| Built 1980 to 1989 | 78 |
| Built 1970 to 1979 | 485 |
| Built 1960 to 1969 | 157 |
| Built 1950 to 1959 | 75 |
| Built 1940 to 1949 | 100 |
| Built 1939 or earlier | 22 |
| Total housing units | 1,260 |
| 1 room | 24 |
| 2 rooms | 174 |
| 3 rooms | 111 |
| 4 rooms | 286 |
| 5 rooms | 287 |
| 6 rooms | 146 |
| 7 rooms | 133 |
| 8 rooms | 99 |
| 9 rooms or more | 0 |
| Median rooms | 4.6 |
| Total housing units | 1,260 |
| No bedroom | 36 |
| 1 bedroom | 232 |
| 2 bedrooms | 448 |
| 3 bedrooms | 482 |
| 4 bedrooms | 62 |
| 5 or more bedrooms | 0 |
| Occupied housing units | 1,048 |
| Owner-occupied | 639 |
| Renter-occupied | 409 |
| Average household size of owner-occupied unit | 2.49 |
| Average household size of renter-occupied unit | 1.97 |
| Occupied housing units | 1,048 |
| Moved in 2017 or later | 0 |
| Moved in 2015 to 2016 | 111 |
| Moved in 2010 to 2014 | 276 |
| Moved in 2000 to 2009 | 378 |
| Moved in 1990 to 1999 | 82 |
| Moved in 1989 and earlier | 201 |
| Owner-occupied units | 639 |
| Less than $50,000 | 30 |
| $50,000 to $99,999 | 0 |
| $100,000 to $149,999 | 82 |
| $150,000 to $199,999 | 65 |
| $200,000 to $299,999 | 143 |
| $300,000 to $499,999 | 236 |
| $500,000 to $999,999 | 83 |
| $1,000,000 or more | 0 |
| Median (dollars) | 299,600 |
| Owner-occupied units | 639 |
| Housing units with a mortgage | 145 |
| Housing units without a mortgage | 494 |
| Occupied units paying rent | 398 |
| Less than $500 | 126 |
| $500 to $999 | 253 |
| $1,000 to $1,499 | 0 |
| $1,500 to $1,999 | 19 |
| $2,000 to $2,499 | 0 |
| $2,500 to $2,999 | 0 |
| $3,000 or more | 0 |
| Median (dollars) | 812 |
| No rent paid | 11 |
Data is based on 2018 Census
ZIP Codes for other locations
State for HAYFORK
California ZIP CodesOther cities in California