HERCULES, CA ZIP Code
| City | HERCULES |
| State | California |
| ZIP Codes count | 1 (see all) |
| Post offices count | 2 (see all) |
| Total population | 25,343 (see all) |
ZIP Code in HERCULES, California
94547
This list contains only 5-digit ZIP codes. Use our zip code lookup by address feature to get the full 9-digit (ZIP+4) code.
List of HERCULES, CA ZIP Codes
| ZIP | TYPE | POPU |
|---|---|---|
| 94547 | STANDARD | 26,050 |
Post offices
HERCULES — Post Office™ 1611 SYCAMORE AVE HERCULES, CA 94547-1707 |
RODEO — Post Office™ 499 PARKER AVE RODEO, CA 94572-1457 |
Envelope example
On the bottom center of the envelope, write the address you want your letter delivered to. Include the following on separate lines:
- Recipient's full name
- Full street address
- City, State, and ZIP Code
Using the same format, write the return address in the top left corner.
Using the full ZIP+4 Code when mailing via the USPS ensures the fastest, most accurate mailing possible. If you are not sure of the full 9-digit ZIP Code, use the 5-digit ZIP Code to avoid loss of letter or package.
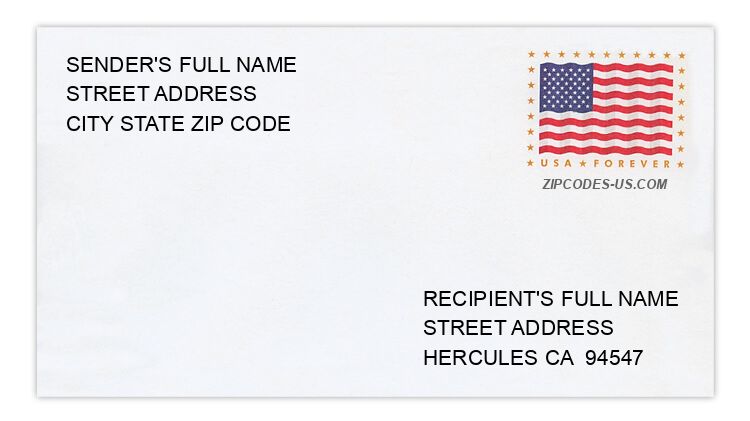
The recipient address information is provided for your reference.
Address example
316 BOATSWAIN CT
HERCULES CA 94547-2033
HERCULES CA 94547-2033
103 CAMELLA CT
HERCULES CA 94547-2687
HERCULES CA 94547-2687
161 FOG CUTTER CV
HERCULES CA 94547-2614
HERCULES CA 94547-2614
23 MORAINE CT
HERCULES CA 94547-1405
HERCULES CA 94547-1405
107 SEQUOIA RD
HERCULES CA 94547-1119
HERCULES CA 94547-1119
153 TUSCANY CT
HERCULES CA 94547-2217
HERCULES CA 94547-2217
Map
Hover over the map to see the ZIP code
Census data for HERCULES, CA
Demographic and housing estimates in HERCULES, CA
| Total population | 25,343 |
| Male | 12,297 |
| Female | 13,046 |
| Total population | 25,343 |
| Under 5 years | 1,176 |
| 5 to 9 years | 1,301 |
| 10 to 14 years | 1,870 |
| 15 to 19 years | 1,323 |
| 20 to 24 years | 1,815 |
| 25 to 34 years | 3,486 |
| 35 to 44 years | 3,367 |
| 45 to 54 years | 3,516 |
| 55 to 59 years | 1,932 |
| 60 to 64 years | 1,848 |
| 65 to 74 years | 2,459 |
| 75 to 84 years | 952 |
| 85 years and over | 298 |
| Median age (years) | 40.2 |
| Under 18 years | 5,230 |
| 16 years and over | 20,713 |
| 18 years and over | 20,113 |
| 21 years and over | 19,319 |
| 62 years and over | 4,831 |
| 65 years and over | 3,709 |
| Total population | 25,343 |
| One race | 23,743 |
| White | 6,984 |
| Black or African American | 3,827 |
| American Indian and Alaska Native | 25 |
| Asian | 11,804 |
| Native Hawaiian and Other Pacific Islander | 156 |
| Some other race | 947 |
| Two or more races | 1,600 |
| Citizen, VOTING AGE 18 and over population | 18,237 |
| Male Citizen, VOTING AGE 18 and over population | 8,795 |
| Female Citizen, VOTING AGE 18 and over population | 9,442 |
Social characteristics in HERCULES, CA
| Total households | 8,098 |
| Family households (families) | 6,376 |
| Married-couple family | 4,920 |
| Male householder, no wife present, family | 412 |
| Female householder, no husband present, family | 1,044 |
| Nonfamily households | 1,722 |
| Average household size | 3.12 |
| Average family size | 3.52 |
Economic characteristics in HERCULES, CA
| Total households | 8,098 |
| Less than $10,000 | 145 |
| $10,000 to $14,999 | 152 |
| $15,000 to $24,999 | 335 |
| $25,000 to $34,999 | 224 |
| $35,000 to $49,999 | 580 |
| $50,000 to $74,999 | 1,128 |
| $75,000 to $99,999 | 910 |
| $100,000 to $149,999 | 2,068 |
| $150,000 to $199,999 | 1,375 |
| $200,000 or more | 1,181 |
| Median household income (dollars) | 110,476 |
Housing characteristics in HERCULES, CA
| Total housing units | 8,351 |
| Occupied housing units | 8,098 |
| Vacant housing units | 253 |
| Total housing units | 8,351 |
| 1-unit, detached | 5,388 |
| 1-unit, attached | 1,699 |
| 2 units | 39 |
| 3 or 4 units | 321 |
| 5 to 9 units | 405 |
| 10 to 19 units | 261 |
| 20 or more units | 221 |
| Mobile home | 17 |
| Boat, RV, van, etc. | 0 |
| Total housing units | 8,351 |
| Built 2014 or later | 60 |
| Built 2010 to 2013 | 53 |
| Built 2000 to 2009 | 2,070 |
| Built 1990 to 1999 | 1,269 |
| Built 1980 to 1989 | 3,045 |
| Built 1970 to 1979 | 1,506 |
| Built 1960 to 1969 | 174 |
| Built 1950 to 1959 | 87 |
| Built 1940 to 1949 | 43 |
| Built 1939 or earlier | 44 |
| Total housing units | 8,351 |
| 1 room | 28 |
| 2 rooms | 145 |
| 3 rooms | 370 |
| 4 rooms | 1,160 |
| 5 rooms | 1,463 |
| 6 rooms | 1,538 |
| 7 rooms | 1,343 |
| 8 rooms | 1,157 |
| 9 rooms or more | 1,147 |
| Median rooms | 6.2 |
| Total housing units | 8,351 |
| No bedroom | 28 |
| 1 bedroom | 364 |
| 2 bedrooms | 1,720 |
| 3 bedrooms | 2,771 |
| 4 bedrooms | 2,591 |
| 5 or more bedrooms | 877 |
| Occupied housing units | 8,098 |
| Owner-occupied | 6,525 |
| Renter-occupied | 1,573 |
| Average household size of owner-occupied unit | 3.08 |
| Average household size of renter-occupied unit | 3.31 |
| Occupied housing units | 8,098 |
| Moved in 2017 or later | 182 |
| Moved in 2015 to 2016 | 822 |
| Moved in 2010 to 2014 | 1,931 |
| Moved in 2000 to 2009 | 2,755 |
| Moved in 1990 to 1999 | 1,189 |
| Moved in 1989 and earlier | 1,219 |
| Owner-occupied units | 6,525 |
| Less than $50,000 | 19 |
| $50,000 to $99,999 | 61 |
| $100,000 to $149,999 | 19 |
| $150,000 to $199,999 | 134 |
| $200,000 to $299,999 | 536 |
| $300,000 to $499,999 | 2,384 |
| $500,000 to $999,999 | 3,311 |
| $1,000,000 or more | 61 |
| Median (dollars) | 510,000 |
| Owner-occupied units | 6,525 |
| Housing units with a mortgage | 5,178 |
| Housing units without a mortgage | 1,347 |
| Occupied units paying rent | 1,535 |
| Less than $500 | 26 |
| $500 to $999 | 127 |
| $1,000 to $1,499 | 278 |
| $1,500 to $1,999 | 320 |
| $2,000 to $2,499 | 389 |
| $2,500 to $2,999 | 294 |
| $3,000 or more | 101 |
| Median (dollars) | 2,021 |
| No rent paid | 38 |
Data is based on 2018 Census
ZIP Codes for other locations
State for HERCULES
California ZIP CodesOther cities in California