HOOPA, CA ZIP Code
| City | HOOPA |
| State | California |
| ZIP Codes count | 1 (see all) |
| Post offices count | 1 (see all) |
| Total population | 3,573 (see all) |
ZIP Code in HOOPA, California
95546
This list contains only 5-digit ZIP codes. Use our zip code lookup by address feature to get the full 9-digit (ZIP+4) code.
List of HOOPA, CA ZIP Codes
| ZIP | TYPE | POPU |
|---|---|---|
| 95546 | STANDARD | 3,121 |
Post offices
HOOPA — Post Office™ 100 STATE HIGHWAY 96 N HOOPA, CA 95546-9603 |
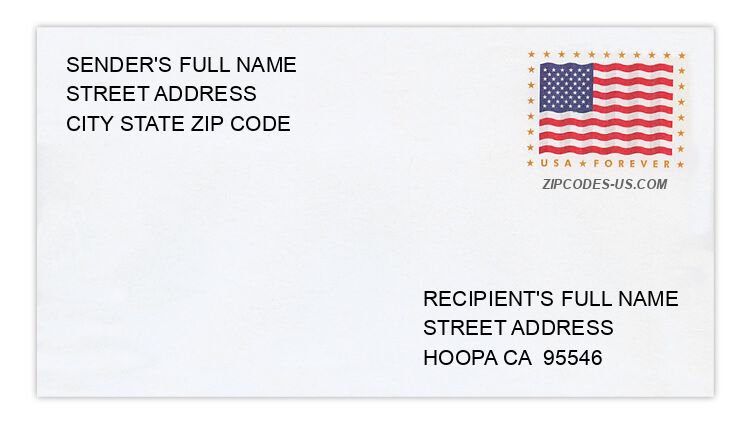
Envelope example
On the bottom center of the envelope, write the address you want your letter delivered to. Include the following on separate lines:
- Recipient's full name
- Full street address
- City, State, and ZIP Code
Using the same format, write the return address in the top left corner.
Using the full ZIP+4 Code when mailing via the USPS ensures the fastest, most accurate mailing possible. If you are not sure of the full 9-digit ZIP Code, use the 5-digit ZIP Code to avoid loss of letter or package.
The recipient address information is provided for your reference.
Address example
192 JACKSON LN
HOOPA CA 95546-9771
HOOPA CA 95546-9771
595 LOWER MILL CREEK RD
HOOPA CA 95546-9432
HOOPA CA 95546-9432
281 MCCOVEY FLT
HOOPA CA 95546-9572
HOOPA CA 95546-9572
7 SITE 12
HOOPA CA 95546-9715
HOOPA CA 95546-9715
67 SITE 4
HOOPA CA 95546-9714
HOOPA CA 95546-9714
9 SITE 8
HOOPA CA 95546-9719
HOOPA CA 95546-9719
Map
Hover over the map to see the ZIP code
Census data for HOOPA, CA
Demographic and housing estimates in HOOPA, CA
| Total population | 3,573 |
| Male | 1,652 |
| Female | 1,921 |
| Total population | 3,573 |
| Under 5 years | 313 |
| 5 to 9 years | 310 |
| 10 to 14 years | 294 |
| 15 to 19 years | 251 |
| 20 to 24 years | 350 |
| 25 to 34 years | 502 |
| 35 to 44 years | 347 |
| 45 to 54 years | 394 |
| 55 to 59 years | 142 |
| 60 to 64 years | 237 |
| 65 to 74 years | 298 |
| 75 to 84 years | 106 |
| 85 years and over | 29 |
| Median age (years) | 29.3 |
| Under 18 years | 1,021 |
| 16 years and over | 2,617 |
| 18 years and over | 2,552 |
| 21 years and over | 2,293 |
| 62 years and over | 570 |
| 65 years and over | 433 |
| Total population | 3,573 |
| One race | 3,280 |
| White | 280 |
| Black or African American | 16 |
| American Indian and Alaska Native | 2,781 |
| Asian | 0 |
| Native Hawaiian and Other Pacific Islander | 200 |
| Some other race | 3 |
| Two or more races | 293 |
| Citizen, VOTING AGE 18 and over population | 2,550 |
| Male Citizen, VOTING AGE 18 and over population | 1,054 |
| Female Citizen, VOTING AGE 18 and over population | 1,496 |
Social characteristics in HOOPA, CA
| Total households | 1,119 |
| Family households (families) | 698 |
| Married-couple family | 304 |
| Male householder, no wife present, family | 105 |
| Female householder, no husband present, family | 289 |
| Nonfamily households | 421 |
| Average household size | 3.17 |
| Average family size | 4.24 |
Economic characteristics in HOOPA, CA
| Total households | 1,119 |
| Less than $10,000 | 169 |
| $10,000 to $14,999 | 144 |
| $15,000 to $24,999 | 150 |
| $25,000 to $34,999 | 76 |
| $35,000 to $49,999 | 198 |
| $50,000 to $74,999 | 181 |
| $75,000 to $99,999 | 83 |
| $100,000 to $149,999 | 67 |
| $150,000 to $199,999 | 0 |
| $200,000 or more | 51 |
| Median household income (dollars) | 36,830 |
Housing characteristics in HOOPA, CA
| Total housing units | 1,376 |
| Occupied housing units | 1,119 |
| Vacant housing units | 257 |
| Total housing units | 1,376 |
| 1-unit, detached | 768 |
| 1-unit, attached | 0 |
| 2 units | 9 |
| 3 or 4 units | 4 |
| 5 to 9 units | 9 |
| 10 to 19 units | 0 |
| 20 or more units | 0 |
| Mobile home | 586 |
| Boat, RV, van, etc. | 0 |
| Total housing units | 1,376 |
| Built 2014 or later | 91 |
| Built 2010 to 2013 | 20 |
| Built 2000 to 2009 | 181 |
| Built 1990 to 1999 | 201 |
| Built 1980 to 1989 | 210 |
| Built 1970 to 1979 | 284 |
| Built 1960 to 1969 | 106 |
| Built 1950 to 1959 | 119 |
| Built 1940 to 1949 | 75 |
| Built 1939 or earlier | 89 |
| Total housing units | 1,376 |
| 1 room | 94 |
| 2 rooms | 103 |
| 3 rooms | 72 |
| 4 rooms | 493 |
| 5 rooms | 318 |
| 6 rooms | 182 |
| 7 rooms | 64 |
| 8 rooms | 50 |
| 9 rooms or more | 0 |
| Median rooms | 4.3 |
| Total housing units | 1,376 |
| No bedroom | 94 |
| 1 bedroom | 130 |
| 2 bedrooms | 443 |
| 3 bedrooms | 528 |
| 4 bedrooms | 146 |
| 5 or more bedrooms | 35 |
| Occupied housing units | 1,119 |
| Owner-occupied | 800 |
| Renter-occupied | 319 |
| Average household size of owner-occupied unit | 3.01 |
| Average household size of renter-occupied unit | 3.57 |
| Occupied housing units | 1,119 |
| Moved in 2017 or later | 49 |
| Moved in 2015 to 2016 | 57 |
| Moved in 2010 to 2014 | 255 |
| Moved in 2000 to 2009 | 327 |
| Moved in 1990 to 1999 | 221 |
| Moved in 1989 and earlier | 210 |
| Owner-occupied units | 800 |
| Less than $50,000 | 183 |
| $50,000 to $99,999 | 79 |
| $100,000 to $149,999 | 29 |
| $150,000 to $199,999 | 93 |
| $200,000 to $299,999 | 198 |
| $300,000 to $499,999 | 126 |
| $500,000 to $999,999 | 92 |
| $1,000,000 or more | 0 |
| Median (dollars) | 207,000 |
| Owner-occupied units | 800 |
| Housing units with a mortgage | 232 |
| Housing units without a mortgage | 568 |
| Occupied units paying rent | 270 |
| Less than $500 | 113 |
| $500 to $999 | 130 |
| $1,000 to $1,499 | 27 |
| $1,500 to $1,999 | 0 |
| $2,000 to $2,499 | 0 |
| $2,500 to $2,999 | 0 |
| $3,000 or more | 0 |
| Median (dollars) | 537 |
| No rent paid | 49 |
Data is based on 2018 Census
ZIP Codes for other locations
State for HOOPA
California ZIP CodesOther cities in California