JURUPA VALLEY, CA ZIP Code
| City | JURUPA VALLEY |
| State | California |
| ZIP Codes count | 2 (see all) |
| Post offices count | 2 (see all) |
| Total population | 103,784 (see all) |
ZIP Codes in JURUPA VALLEY, California
91752, 92509
This list contains only 5-digit ZIP codes. Use our zip code lookup by address feature to get the full 9-digit (ZIP+4) code.
List of JURUPA VALLEY, CA ZIP Codes
| ZIP | TYPE | POPU |
|---|---|---|
| 91752 | STANDARD | 35,641 |
| 92509 | STANDARD | 80,036 |
Post offices
MIRA LOMA — Post Office™ 10798 JURUPA RD JURUPA VALLEY, CA 91752-9998 |
RUBIDOUX — Post Office™ 8082 LIMONITE AVE STE 1 JURUPA VALLEY, CA 92509-6127 |
Envelope example
On the bottom center of the envelope, write the address you want your letter delivered to. Include the following on separate lines:
- Recipient's full name
- Full street address
- City, State, and ZIP Code
Using the same format, write the return address in the top left corner.
Using the full ZIP+4 Code when mailing via the USPS ensures the fastest, most accurate mailing possible. If you are not sure of the full 9-digit ZIP Code, use the 5-digit ZIP Code to avoid loss of letter or package.
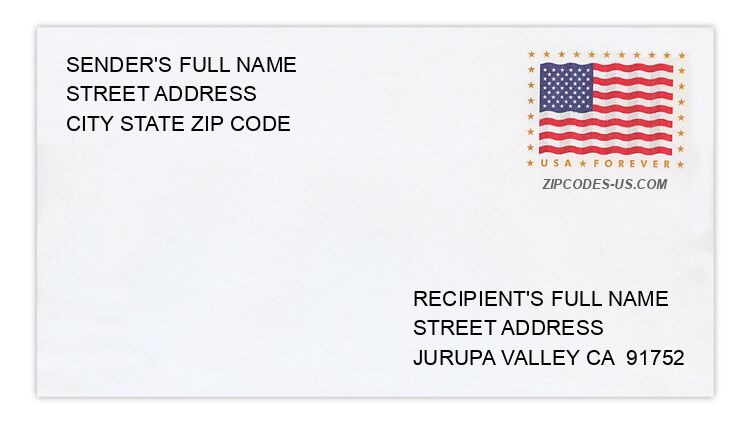
The recipient address information is provided for your reference.
Address example
9237 ORCO PKWY
JURUPA VALLEY CA 92509-0902
JURUPA VALLEY CA 92509-0902
11834 PLOVER WAY
JURUPA VALLEY CA 91752-4512
JURUPA VALLEY CA 91752-4512
5835 SAMANTHA PL
JURUPA VALLEY CA 92509-4208
JURUPA VALLEY CA 92509-4208
4774 TROY CT
JURUPA VALLEY CA 92509-2004
JURUPA VALLEY CA 92509-2004
6827 VAN BUREN BLVD
JURUPA VALLEY CA 92509-6045
JURUPA VALLEY CA 92509-6045
6752 WOODMERE DR
JURUPA VALLEY CA 92509-0736
JURUPA VALLEY CA 92509-0736
Map
Hover over the map to see the ZIP code
Census data for JURUPA VALLEY, CA
Demographic and housing estimates in JURUPA VALLEY, CA
| Total population | 103,784 |
| Male | 52,747 |
| Female | 51,037 |
| Total population | 103,784 |
| Under 5 years | 7,738 |
| 5 to 9 years | 8,388 |
| 10 to 14 years | 7,732 |
| 15 to 19 years | 8,062 |
| 20 to 24 years | 8,808 |
| 25 to 34 years | 15,015 |
| 35 to 44 years | 13,283 |
| 45 to 54 years | 13,002 |
| 55 to 59 years | 6,091 |
| 60 to 64 years | 5,254 |
| 65 to 74 years | 6,356 |
| 75 to 84 years | 2,765 |
| 85 years and over | 1,290 |
| Median age (years) | 32.2 |
| Under 18 years | 28,756 |
| 16 years and over | 78,260 |
| 18 years and over | 75,028 |
| 21 years and over | 69,871 |
| 62 years and over | 13,282 |
| 65 years and over | 10,411 |
| Total population | 103,784 |
| One race | 99,731 |
| White | 54,959 |
| Black or African American | 3,294 |
| American Indian and Alaska Native | 984 |
| Asian | 3,320 |
| Native Hawaiian and Other Pacific Islander | 191 |
| Some other race | 36,983 |
| Two or more races | 4,053 |
| Citizen, VOTING AGE 18 and over population | 59,792 |
| Male Citizen, VOTING AGE 18 and over population | 30,795 |
| Female Citizen, VOTING AGE 18 and over population | 28,997 |
Social characteristics in JURUPA VALLEY, CA
| Total households | 24,859 |
| Family households (families) | 20,320 |
| Married-couple family | 14,864 |
| Male householder, no wife present, family | 1,819 |
| Female householder, no husband present, family | 3,637 |
| Nonfamily households | 4,539 |
| Average household size | 4.14 |
| Average family size | 4.55 |
Economic characteristics in JURUPA VALLEY, CA
| Total households | 24,859 |
| Less than $10,000 | 986 |
| $10,000 to $14,999 | 934 |
| $15,000 to $24,999 | 1,964 |
| $25,000 to $34,999 | 2,310 |
| $35,000 to $49,999 | 3,019 |
| $50,000 to $74,999 | 4,862 |
| $75,000 to $99,999 | 3,574 |
| $100,000 to $149,999 | 4,373 |
| $150,000 to $199,999 | 1,684 |
| $200,000 or more | 1,153 |
| Median household income (dollars) | 67,002 |
Housing characteristics in JURUPA VALLEY, CA
| Total housing units | 26,083 |
| Occupied housing units | 24,859 |
| Vacant housing units | 1,224 |
| Total housing units | 26,083 |
| 1-unit, detached | 20,242 |
| 1-unit, attached | 937 |
| 2 units | 194 |
| 3 or 4 units | 187 |
| 5 to 9 units | 442 |
| 10 to 19 units | 1,051 |
| 20 or more units | 1,196 |
| Mobile home | 1,823 |
| Boat, RV, van, etc. | 11 |
| Total housing units | 26,083 |
| Built 2014 or later | 608 |
| Built 2010 to 2013 | 360 |
| Built 2000 to 2009 | 2,806 |
| Built 1990 to 1999 | 2,387 |
| Built 1980 to 1989 | 5,717 |
| Built 1970 to 1979 | 5,436 |
| Built 1960 to 1969 | 2,965 |
| Built 1950 to 1959 | 3,491 |
| Built 1940 to 1949 | 1,333 |
| Built 1939 or earlier | 980 |
| Total housing units | 26,083 |
| 1 room | 679 |
| 2 rooms | 552 |
| 3 rooms | 1,907 |
| 4 rooms | 3,830 |
| 5 rooms | 6,122 |
| 6 rooms | 5,529 |
| 7 rooms | 4,048 |
| 8 rooms | 1,975 |
| 9 rooms or more | 1,441 |
| Median rooms | 5.5 |
| Total housing units | 26,083 |
| No bedroom | 786 |
| 1 bedroom | 1,856 |
| 2 bedrooms | 4,914 |
| 3 bedrooms | 10,018 |
| 4 bedrooms | 7,206 |
| 5 or more bedrooms | 1,303 |
| Occupied housing units | 24,859 |
| Owner-occupied | 16,734 |
| Renter-occupied | 8,125 |
| Average household size of owner-occupied unit | 4.23 |
| Average household size of renter-occupied unit | 3.96 |
| Occupied housing units | 24,859 |
| Moved in 2017 or later | 1,040 |
| Moved in 2015 to 2016 | 2,444 |
| Moved in 2010 to 2014 | 7,182 |
| Moved in 2000 to 2009 | 7,430 |
| Moved in 1990 to 1999 | 3,479 |
| Moved in 1989 and earlier | 3,284 |
| Owner-occupied units | 16,734 |
| Less than $50,000 | 1,203 |
| $50,000 to $99,999 | 490 |
| $100,000 to $149,999 | 562 |
| $150,000 to $199,999 | 637 |
| $200,000 to $299,999 | 3,375 |
| $300,000 to $499,999 | 8,702 |
| $500,000 to $999,999 | 1,672 |
| $1,000,000 or more | 93 |
| Median (dollars) | 339,400 |
| Owner-occupied units | 16,734 |
| Housing units with a mortgage | 12,667 |
| Housing units without a mortgage | 4,067 |
| Occupied units paying rent | 7,845 |
| Less than $500 | 260 |
| $500 to $999 | 2,084 |
| $1,000 to $1,499 | 2,908 |
| $1,500 to $1,999 | 2,085 |
| $2,000 to $2,499 | 362 |
| $2,500 to $2,999 | 91 |
| $3,000 or more | 55 |
| Median (dollars) | 1,247 |
| No rent paid | 280 |
Data is based on 2018 Census
ZIP Codes for other locations
State for JURUPA VALLEY
California ZIP CodesOther cities in California