LANCASTER, CA ZIP Code
| City | LANCASTER |
| State | California |
| ZIP Codes count | 6 (see all) |
| Post offices count | 2 (see all) |
| Total population | 159,662 (see all) |
ZIP Codes in LANCASTER, California
The ZIP Codes in LANCASTER, California fall within the range from 93534 to 93586. LANCASTER is covered by 6 ZIP Codes: 3 Standard and 3 PO Box. Below is the complete list:
93534, 93535, 93536, 93539, 93584, 93586
This list contains only 5-digit ZIP codes. Use our zip code lookup by address feature to get the full 9-digit (ZIP+4) code.
List of LANCASTER, CA ZIP Codes
| ZIP | TYPE | POPU |
|---|---|---|
| 93534 | STANDARD | 43,535 |
| 93535 | STANDARD | 79,522 |
| 93536 | STANDARD | 73,417 |
| 93539 | PO BOX | – |
| 93584 | PO BOX | – |
| 93586 | PO BOX | – |
Post offices
CEDAR — Post Office™ 567 W LANCASTER BLVD LANCASTER, CA 93534-2514 |
LANCASTER — Post Office™ 43824 20TH ST W LANCASTER, CA 93534-5202 |
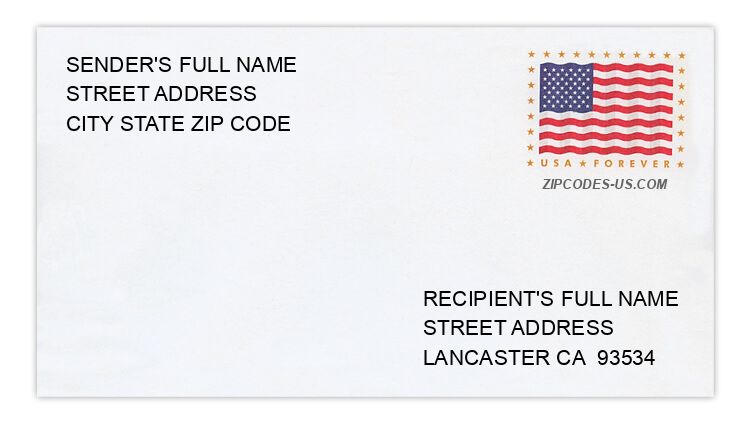
Envelope example
On the bottom center of the envelope, write the address you want your letter delivered to. Include the following on separate lines:
- Recipient's full name
- Full street address
- City, State, and ZIP Code
Using the same format, write the return address in the top left corner.
Using the full ZIP+4 Code when mailing via the USPS ensures the fastest, most accurate mailing possible. If you are not sure of the full 9-digit ZIP Code, use the 5-digit ZIP Code to avoid loss of letter or package.
The recipient address information is provided for your reference.
Address example
42529 36TH ST W
LANCASTER CA 93536-4104
LANCASTER CA 93536-4104
1552 BLUEBELL ST
LANCASTER CA 93535-4454
LANCASTER CA 93535-4454
43961 BROADWATER AVE
LANCASTER CA 93535-4431
LANCASTER CA 93535-4431
2665 DESERT ROSE DR
LANCASTER CA 93536-3321
LANCASTER CA 93536-3321
3099 MINFORD ST
LANCASTER CA 93536-8393
LANCASTER CA 93536-8393
6077 W AVENUE L12
LANCASTER CA 93536-3742
LANCASTER CA 93536-3742
Map
Hover over the map to see the ZIP code
Census data for LANCASTER, CA
Demographic and housing estimates in LANCASTER, CA
| Total population | 159,662 |
| Male | 80,299 |
| Female | 79,363 |
| Total population | 159,662 |
| Under 5 years | 12,743 |
| 5 to 9 years | 12,405 |
| 10 to 14 years | 12,764 |
| 15 to 19 years | 12,581 |
| 20 to 24 years | 10,838 |
| 25 to 34 years | 23,657 |
| 35 to 44 years | 20,558 |
| 45 to 54 years | 20,498 |
| 55 to 59 years | 9,971 |
| 60 to 64 years | 8,031 |
| 65 to 74 years | 9,671 |
| 75 to 84 years | 4,434 |
| 85 years and over | 1,511 |
| Median age (years) | 32.4 |
| Under 18 years | 45,856 |
| 16 years and over | 119,308 |
| 18 years and over | 113,806 |
| 21 years and over | 106,701 |
| 62 years and over | 19,960 |
| 65 years and over | 15,616 |
| Total population | 159,662 |
| One race | 152,239 |
| White | 97,564 |
| Black or African American | 34,764 |
| American Indian and Alaska Native | 1,077 |
| Asian | 7,024 |
| Native Hawaiian and Other Pacific Islander | 244 |
| Some other race | 11,566 |
| Two or more races | 7,423 |
| Citizen, VOTING AGE 18 and over population | 107,326 |
| Male Citizen, VOTING AGE 18 and over population | 53,177 |
| Female Citizen, VOTING AGE 18 and over population | 54,149 |
Social characteristics in LANCASTER, CA
| Total households | 47,650 |
| Family households (families) | 35,216 |
| Married-couple family | 22,780 |
| Male householder, no wife present, family | 3,361 |
| Female householder, no husband present, family | 9,075 |
| Nonfamily households | 12,434 |
| Average household size | 3.20 |
| Average family size | 3.73 |
Economic characteristics in LANCASTER, CA
| Total households | 47,650 |
| Less than $10,000 | 6,432 |
| $10,000 to $14,999 | 2,465 |
| $15,000 to $24,999 | 3,806 |
| $25,000 to $34,999 | 3,602 |
| $35,000 to $49,999 | 6,827 |
| $50,000 to $74,999 | 8,320 |
| $75,000 to $99,999 | 6,041 |
| $100,000 to $149,999 | 5,932 |
| $150,000 to $199,999 | 2,478 |
| $200,000 or more | 1,747 |
| Median household income (dollars) | 52,504 |
Housing characteristics in LANCASTER, CA
| Total housing units | 52,516 |
| Occupied housing units | 47,650 |
| Vacant housing units | 4,866 |
| Total housing units | 52,516 |
| 1-unit, detached | 36,584 |
| 1-unit, attached | 808 |
| 2 units | 511 |
| 3 or 4 units | 2,558 |
| 5 to 9 units | 2,854 |
| 10 to 19 units | 1,416 |
| 20 or more units | 3,722 |
| Mobile home | 4,012 |
| Boat, RV, van, etc. | 51 |
| Total housing units | 52,516 |
| Built 2014 or later | 146 |
| Built 2010 to 2013 | 752 |
| Built 2000 to 2009 | 8,191 |
| Built 1990 to 1999 | 8,261 |
| Built 1980 to 1989 | 18,317 |
| Built 1970 to 1979 | 8,588 |
| Built 1960 to 1969 | 2,863 |
| Built 1950 to 1959 | 4,391 |
| Built 1940 to 1949 | 451 |
| Built 1939 or earlier | 556 |
| Total housing units | 52,516 |
| 1 room | 992 |
| 2 rooms | 1,023 |
| 3 rooms | 3,275 |
| 4 rooms | 8,403 |
| 5 rooms | 6,389 |
| 6 rooms | 9,647 |
| 7 rooms | 10,358 |
| 8 rooms | 7,438 |
| 9 rooms or more | 4,991 |
| Median rooms | 6.1 |
| Total housing units | 52,516 |
| No bedroom | 1,075 |
| 1 bedroom | 3,449 |
| 2 bedrooms | 9,893 |
| 3 bedrooms | 20,312 |
| 4 bedrooms | 13,993 |
| 5 or more bedrooms | 3,794 |
| Occupied housing units | 47,650 |
| Owner-occupied | 25,462 |
| Renter-occupied | 22,188 |
| Average household size of owner-occupied unit | 3.28 |
| Average household size of renter-occupied unit | 3.12 |
| Occupied housing units | 47,650 |
| Moved in 2017 or later | 1,459 |
| Moved in 2015 to 2016 | 5,439 |
| Moved in 2010 to 2014 | 19,231 |
| Moved in 2000 to 2009 | 13,490 |
| Moved in 1990 to 1999 | 5,210 |
| Moved in 1989 and earlier | 2,821 |
| Owner-occupied units | 25,462 |
| Less than $50,000 | 2,063 |
| $50,000 to $99,999 | 1,109 |
| $100,000 to $149,999 | 2,395 |
| $150,000 to $199,999 | 3,446 |
| $200,000 to $299,999 | 8,746 |
| $300,000 to $499,999 | 6,285 |
| $500,000 to $999,999 | 1,102 |
| $1,000,000 or more | 316 |
| Median (dollars) | 242,100 |
| Owner-occupied units | 25,462 |
| Housing units with a mortgage | 19,383 |
| Housing units without a mortgage | 6,079 |
| Occupied units paying rent | 21,570 |
| Less than $500 | 2,067 |
| $500 to $999 | 5,516 |
| $1,000 to $1,499 | 8,544 |
| $1,500 to $1,999 | 3,783 |
| $2,000 to $2,499 | 1,535 |
| $2,500 to $2,999 | 50 |
| $3,000 or more | 75 |
| Median (dollars) | 1,162 |
| No rent paid | 618 |
Data is based on 2018 Census
ZIP Codes for other locations
State for LANCASTER
California ZIP CodesOther cities in California