LINDSAY, CA ZIP Code
| City | LINDSAY |
| State | California |
| ZIP Codes count | 1 (see all) |
| Post offices count | 1 (see all) |
| Total population | 13,232 (see all) |
ZIP Code in LINDSAY, California
93247
This list contains only 5-digit ZIP codes. Use our zip code lookup by address feature to get the full 9-digit (ZIP+4) code.
List of LINDSAY, CA ZIP Codes
| ZIP | TYPE | POPU |
|---|---|---|
| 93247 | STANDARD | 17,182 |
Post offices
LINDSAY — Post Office™ 262 E HONOLULU ST LINDSAY, CA 93247-9998 |
Envelope example
On the bottom center of the envelope, write the address you want your letter delivered to. Include the following on separate lines:
- Recipient's full name
- Full street address
- City, State, and ZIP Code
Using the same format, write the return address in the top left corner.
Using the full ZIP+4 Code when mailing via the USPS ensures the fastest, most accurate mailing possible. If you are not sure of the full 9-digit ZIP Code, use the 5-digit ZIP Code to avoid loss of letter or package.
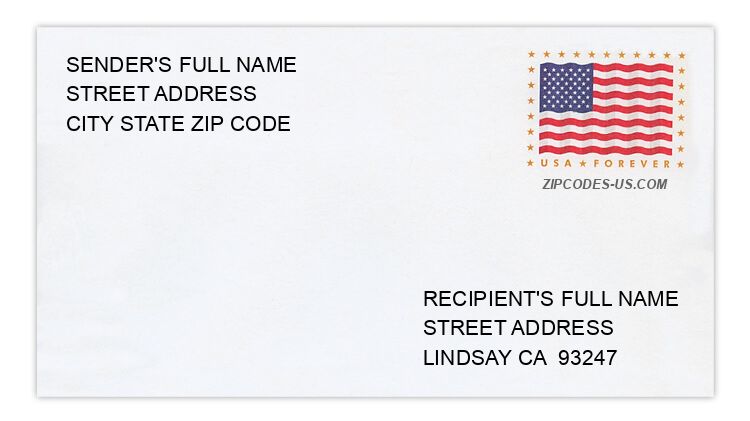
The recipient address information is provided for your reference.
Address example
368 3RD ST
LINDSAY CA 93247-21ND
LINDSAY CA 93247-21ND
1081 HAMLIN WAY
LINDSAY CA 93247-1528
LINDSAY CA 93247-1528
447 MEMORY LN
LINDSAY CA 93247-2345
LINDSAY CA 93247-2345
968 MULBERRY CT
LINDSAY CA 93247-1487
LINDSAY CA 93247-1487
232 PLEASANT ST
LINDSAY CA 93247-2520
LINDSAY CA 93247-2520
976 PRINCETON AVE
LINDSAY CA 93247-1778
LINDSAY CA 93247-1778
Map
Hover over the map to see the ZIP code
Census data for LINDSAY, CA
Demographic and housing estimates in LINDSAY, CA
| Total population | 13,232 |
| Male | 7,037 |
| Female | 6,195 |
| Total population | 13,232 |
| Under 5 years | 1,190 |
| 5 to 9 years | 1,205 |
| 10 to 14 years | 1,428 |
| 15 to 19 years | 1,091 |
| 20 to 24 years | 936 |
| 25 to 34 years | 1,973 |
| 35 to 44 years | 1,237 |
| 45 to 54 years | 1,672 |
| 55 to 59 years | 844 |
| 60 to 64 years | 363 |
| 65 to 74 years | 791 |
| 75 to 84 years | 349 |
| 85 years and over | 153 |
| Median age (years) | 30.1 |
| Under 18 years | 4,478 |
| 16 years and over | 9,237 |
| 18 years and over | 8,754 |
| 21 years and over | 8,034 |
| 62 years and over | 1,462 |
| 65 years and over | 1,293 |
| Total population | 13,232 |
| One race | 12,961 |
| White | 10,667 |
| Black or African American | 48 |
| American Indian and Alaska Native | 44 |
| Asian | 160 |
| Native Hawaiian and Other Pacific Islander | 0 |
| Some other race | 2,042 |
| Two or more races | 271 |
| Citizen, VOTING AGE 18 and over population | 5,202 |
| Male Citizen, VOTING AGE 18 and over population | 2,550 |
| Female Citizen, VOTING AGE 18 and over population | 2,652 |
Social characteristics in LINDSAY, CA
| Total households | 3,669 |
| Family households (families) | 2,819 |
| Married-couple family | 1,933 |
| Male householder, no wife present, family | 290 |
| Female householder, no husband present, family | 596 |
| Nonfamily households | 850 |
| Average household size | 3.58 |
| Average family size | 4.16 |
Economic characteristics in LINDSAY, CA
| Total households | 3,669 |
| Less than $10,000 | 474 |
| $10,000 to $14,999 | 285 |
| $15,000 to $24,999 | 708 |
| $25,000 to $34,999 | 626 |
| $35,000 to $49,999 | 506 |
| $50,000 to $74,999 | 653 |
| $75,000 to $99,999 | 246 |
| $100,000 to $149,999 | 103 |
| $150,000 to $199,999 | 28 |
| $200,000 or more | 40 |
| Median household income (dollars) | 30,949 |
Housing characteristics in LINDSAY, CA
| Total housing units | 3,946 |
| Occupied housing units | 3,669 |
| Vacant housing units | 277 |
| Total housing units | 3,946 |
| 1-unit, detached | 2,826 |
| 1-unit, attached | 85 |
| 2 units | 49 |
| 3 or 4 units | 218 |
| 5 to 9 units | 214 |
| 10 to 19 units | 121 |
| 20 or more units | 251 |
| Mobile home | 182 |
| Boat, RV, van, etc. | 0 |
| Total housing units | 3,946 |
| Built 2014 or later | 56 |
| Built 2010 to 2013 | 223 |
| Built 2000 to 2009 | 484 |
| Built 1990 to 1999 | 291 |
| Built 1980 to 1989 | 403 |
| Built 1970 to 1979 | 706 |
| Built 1960 to 1969 | 214 |
| Built 1950 to 1959 | 434 |
| Built 1940 to 1949 | 292 |
| Built 1939 or earlier | 843 |
| Total housing units | 3,946 |
| 1 room | 37 |
| 2 rooms | 116 |
| 3 rooms | 418 |
| 4 rooms | 897 |
| 5 rooms | 1,263 |
| 6 rooms | 806 |
| 7 rooms | 208 |
| 8 rooms | 98 |
| 9 rooms or more | 103 |
| Median rooms | 4.9 |
| Total housing units | 3,946 |
| No bedroom | 77 |
| 1 bedroom | 393 |
| 2 bedrooms | 1,304 |
| 3 bedrooms | 1,643 |
| 4 bedrooms | 496 |
| 5 or more bedrooms | 33 |
| Occupied housing units | 3,669 |
| Owner-occupied | 1,995 |
| Renter-occupied | 1,674 |
| Average household size of owner-occupied unit | 3.64 |
| Average household size of renter-occupied unit | 3.50 |
| Occupied housing units | 3,669 |
| Moved in 2017 or later | 151 |
| Moved in 2015 to 2016 | 466 |
| Moved in 2010 to 2014 | 1,053 |
| Moved in 2000 to 2009 | 1,111 |
| Moved in 1990 to 1999 | 343 |
| Moved in 1989 and earlier | 545 |
| Owner-occupied units | 1,995 |
| Less than $50,000 | 178 |
| $50,000 to $99,999 | 393 |
| $100,000 to $149,999 | 560 |
| $150,000 to $199,999 | 524 |
| $200,000 to $299,999 | 250 |
| $300,000 to $499,999 | 75 |
| $500,000 to $999,999 | 15 |
| $1,000,000 or more | 0 |
| Median (dollars) | 140,800 |
| Owner-occupied units | 1,995 |
| Housing units with a mortgage | 1,286 |
| Housing units without a mortgage | 709 |
| Occupied units paying rent | 1,635 |
| Less than $500 | 280 |
| $500 to $999 | 1,122 |
| $1,000 to $1,499 | 192 |
| $1,500 to $1,999 | 11 |
| $2,000 to $2,499 | 30 |
| $2,500 to $2,999 | 0 |
| $3,000 or more | 0 |
| Median (dollars) | 772 |
| No rent paid | 39 |
Data is based on 2018 Census
ZIP Codes for other locations
State for LINDSAY
California ZIP CodesOther cities in California