LOS OLIVOS, CA ZIP Code
| City | LOS OLIVOS |
| State | California |
| ZIP Codes count | 1 (see all) |
| Post offices count | 1 (see all) |
| Total population | 831 (see all) |
ZIP Code in LOS OLIVOS, California
93441
This list contains only 5-digit ZIP codes. Use our zip code lookup by address feature to get the full 9-digit (ZIP+4) code.
List of LOS OLIVOS, CA ZIP Codes
| ZIP | TYPE | POPU |
|---|---|---|
| 93441 | PO BOX | 1,059 |
Post offices
LOS OLIVOS — Post Office™ 2880 GRAND AVE STE B LOS OLIVOS, CA 93441-9997 |
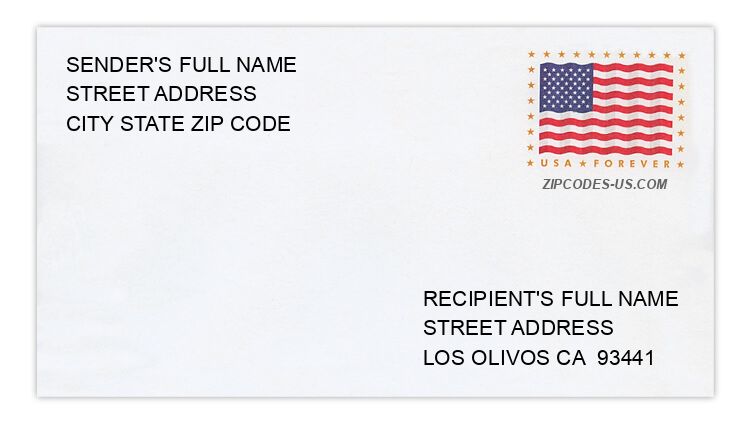
Envelope example
On the bottom center of the envelope, write the address you want your letter delivered to. Include the following on separate lines:
- Recipient's full name
- Full street address
- City, State, and ZIP Code
Using the same format, write the return address in the top left corner.
Using the full ZIP+4 Code when mailing via the USPS ensures the fastest, most accurate mailing possible. If you are not sure of the full 9-digit ZIP Code, use the 5-digit ZIP Code to avoid loss of letter or package.
The recipient address information is provided for your reference.
Address example
3245 ACAMPO RD
LOS OLIVOS CA 93441-4502
LOS OLIVOS CA 93441-4502
3242 CALKINS RD
LOS OLIVOS CA 93441-4511
LOS OLIVOS CA 93441-4511
2805 GAVIOTA ST
LOS OLIVOS CA 93441-4534
LOS OLIVOS CA 93441-4534
2206 JONATA ST
LOS OLIVOS CA 93441-4538
LOS OLIVOS CA 93441-4538
2224 OLIVET AVE
LOS OLIVOS CA 93441-4548
LOS OLIVOS CA 93441-4548
2444 PARK ST
LOS OLIVOS CA 93441-4549
LOS OLIVOS CA 93441-4549
Map
Hover over the map to see the ZIP code
Census data for LOS OLIVOS, CA
Demographic and housing estimates in LOS OLIVOS, CA
| Total population | 831 |
| Male | 401 |
| Female | 430 |
| Total population | 831 |
| Under 5 years | 3 |
| 5 to 9 years | 49 |
| 10 to 14 years | 54 |
| 15 to 19 years | 52 |
| 20 to 24 years | 25 |
| 25 to 34 years | 67 |
| 35 to 44 years | 103 |
| 45 to 54 years | 140 |
| 55 to 59 years | 75 |
| 60 to 64 years | 68 |
| 65 to 74 years | 75 |
| 75 to 84 years | 90 |
| 85 years and over | 30 |
| Median age (years) | 50.1 |
| Under 18 years | 138 |
| 16 years and over | 713 |
| 18 years and over | 693 |
| 21 years and over | 664 |
| 62 years and over | 233 |
| 65 years and over | 195 |
| Total population | 831 |
| One race | 813 |
| White | 743 |
| Black or African American | 0 |
| American Indian and Alaska Native | 0 |
| Asian | 0 |
| Native Hawaiian and Other Pacific Islander | 43 |
| Some other race | 27 |
| Two or more races | 18 |
| Citizen, VOTING AGE 18 and over population | 664 |
| Male Citizen, VOTING AGE 18 and over population | 309 |
| Female Citizen, VOTING AGE 18 and over population | 355 |
Social characteristics in LOS OLIVOS, CA
| Total households | 369 |
| Family households (families) | 239 |
| Married-couple family | 204 |
| Male householder, no wife present, family | 4 |
| Female householder, no husband present, family | 31 |
| Nonfamily households | 130 |
| Average household size | 2.25 |
| Average family size | 2.92 |
Economic characteristics in LOS OLIVOS, CA
| Total households | 369 |
| Less than $10,000 | 0 |
| $10,000 to $14,999 | 13 |
| $15,000 to $24,999 | 36 |
| $25,000 to $34,999 | 36 |
| $35,000 to $49,999 | 13 |
| $50,000 to $74,999 | 39 |
| $75,000 to $99,999 | 34 |
| $100,000 to $149,999 | 81 |
| $150,000 to $199,999 | 39 |
| $200,000 or more | 78 |
| Median household income (dollars) | 107,321 |
Housing characteristics in LOS OLIVOS, CA
| Total housing units | 435 |
| Occupied housing units | 369 |
| Vacant housing units | 66 |
| Total housing units | 435 |
| 1-unit, detached | 426 |
| 1-unit, attached | 2 |
| 2 units | 0 |
| 3 or 4 units | 7 |
| 5 to 9 units | 0 |
| 10 to 19 units | 0 |
| 20 or more units | 0 |
| Mobile home | 0 |
| Boat, RV, van, etc. | 0 |
| Total housing units | 435 |
| Built 2014 or later | 0 |
| Built 2010 to 2013 | 0 |
| Built 2000 to 2009 | 38 |
| Built 1990 to 1999 | 80 |
| Built 1980 to 1989 | 63 |
| Built 1970 to 1979 | 165 |
| Built 1960 to 1969 | 41 |
| Built 1950 to 1959 | 28 |
| Built 1940 to 1949 | 3 |
| Built 1939 or earlier | 17 |
| Total housing units | 435 |
| 1 room | 0 |
| 2 rooms | 0 |
| 3 rooms | 38 |
| 4 rooms | 52 |
| 5 rooms | 94 |
| 6 rooms | 118 |
| 7 rooms | 64 |
| 8 rooms | 40 |
| 9 rooms or more | 29 |
| Median rooms | 5.8 |
| Total housing units | 435 |
| No bedroom | 0 |
| 1 bedroom | 14 |
| 2 bedrooms | 91 |
| 3 bedrooms | 220 |
| 4 bedrooms | 100 |
| 5 or more bedrooms | 10 |
| Occupied housing units | 369 |
| Owner-occupied | 289 |
| Renter-occupied | 80 |
| Average household size of owner-occupied unit | 2.33 |
| Average household size of renter-occupied unit | 1.98 |
| Occupied housing units | 369 |
| Moved in 2017 or later | 0 |
| Moved in 2015 to 2016 | 21 |
| Moved in 2010 to 2014 | 58 |
| Moved in 2000 to 2009 | 118 |
| Moved in 1990 to 1999 | 60 |
| Moved in 1989 and earlier | 112 |
| Owner-occupied units | 289 |
| Less than $50,000 | 0 |
| $50,000 to $99,999 | 0 |
| $100,000 to $149,999 | 6 |
| $150,000 to $199,999 | 0 |
| $200,000 to $299,999 | 0 |
| $300,000 to $499,999 | 23 |
| $500,000 to $999,999 | 156 |
| $1,000,000 or more | 104 |
| Median (dollars) | 905,400 |
| Owner-occupied units | 289 |
| Housing units with a mortgage | 201 |
| Housing units without a mortgage | 88 |
| Occupied units paying rent | 50 |
| Less than $500 | 4 |
| $500 to $999 | 8 |
| $1,000 to $1,499 | 0 |
| $1,500 to $1,999 | 8 |
| $2,000 to $2,499 | 26 |
| $2,500 to $2,999 | 4 |
| $3,000 or more | 0 |
| Median (dollars) | 2,096 |
| No rent paid | 30 |
Data is based on 2018 Census
ZIP Codes for other locations
State for LOS OLIVOS
California ZIP CodesOther cities in California