MARYSVILLE, CA ZIP Code
| City | MARYSVILLE |
| State | California |
| ZIP Codes count | 2 (see all) |
| Post offices count | 2 (see all) |
| Total population | 12,282 (see all) |
ZIP Codes in MARYSVILLE, California
95901, 95903
This list contains only 5-digit ZIP codes. Use our zip code lookup by address feature to get the full 9-digit (ZIP+4) code.
List of MARYSVILLE, CA ZIP Codes
| ZIP | TYPE | POPU |
|---|---|---|
| 95901 | STANDARD | 36,176 |
| 95903 | STANDARD | 1,730 |
Post offices
BEALE AFB — Post Office™ 17852 16TH ST BEALE AFB, CA 95903-9998 |
MARYSVILLE — Post Office™ 407 C ST MARYSVILLE, CA 95901-5715 |
Envelope example
On the bottom center of the envelope, write the address you want your letter delivered to. Include the following on separate lines:
- Recipient's full name
- Full street address
- City, State, and ZIP Code
Using the same format, write the return address in the top left corner.
Using the full ZIP+4 Code when mailing via the USPS ensures the fastest, most accurate mailing possible. If you are not sure of the full 9-digit ZIP Code, use the 5-digit ZIP Code to avoid loss of letter or package.
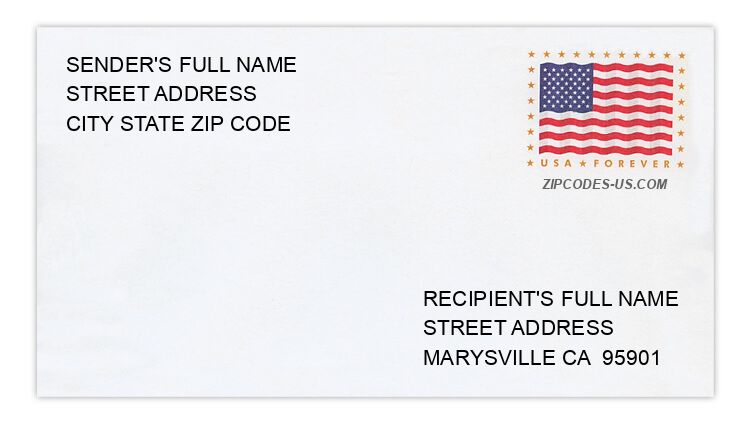
The recipient address information is provided for your reference.
Address example
7380 BOXWOOD WAY
MARYSVILLE CA 95901-9211
MARYSVILLE CA 95901-9211
540 E ST
MARYSVILLE CA 95901-5530
MARYSVILLE CA 95901-5530
6390 MELISSA CT
MARYSVILLE CA 95901-8067
MARYSVILLE CA 95901-8067
5600 STONY CREEK WAY
MARYSVILLE CA 95901-8298
MARYSVILLE CA 95901-8298
6059 VIERRA LN
MARYSVILLE CA 95901-6483
MARYSVILLE CA 95901-6483
2449 W HALLWOOD BLVD
MARYSVILLE CA 95901-9409
MARYSVILLE CA 95901-9409
Map
Hover over the map to see the ZIP code
Census data for MARYSVILLE, CA
Demographic and housing estimates in MARYSVILLE, CA
| Total population | 12,282 |
| Male | 6,033 |
| Female | 6,249 |
| Total population | 12,282 |
| Under 5 years | 1,053 |
| 5 to 9 years | 502 |
| 10 to 14 years | 876 |
| 15 to 19 years | 900 |
| 20 to 24 years | 1,200 |
| 25 to 34 years | 2,388 |
| 35 to 44 years | 1,240 |
| 45 to 54 years | 1,439 |
| 55 to 59 years | 761 |
| 60 to 64 years | 510 |
| 65 to 74 years | 635 |
| 75 to 84 years | 354 |
| 85 years and over | 424 |
| Median age (years) | 31.1 |
| Under 18 years | 2,930 |
| 16 years and over | 9,554 |
| 18 years and over | 9,352 |
| 21 years and over | 8,777 |
| 62 years and over | 1,659 |
| 65 years and over | 1,413 |
| Total population | 12,282 |
| One race | 11,384 |
| White | 10,169 |
| Black or African American | 242 |
| American Indian and Alaska Native | 198 |
| Asian | 490 |
| Native Hawaiian and Other Pacific Islander | 4 |
| Some other race | 281 |
| Two or more races | 898 |
| Citizen, VOTING AGE 18 and over population | 8,607 |
| Male Citizen, VOTING AGE 18 and over population | 4,054 |
| Female Citizen, VOTING AGE 18 and over population | 4,553 |
Social characteristics in MARYSVILLE, CA
| Total households | 4,592 |
| Family households (families) | 2,945 |
| Married-couple family | 1,906 |
| Male householder, no wife present, family | 214 |
| Female householder, no husband present, family | 825 |
| Nonfamily households | 1,647 |
| Average household size | 2.55 |
| Average family size | 3.12 |
Economic characteristics in MARYSVILLE, CA
| Total households | 4,592 |
| Less than $10,000 | 201 |
| $10,000 to $14,999 | 507 |
| $15,000 to $24,999 | 563 |
| $25,000 to $34,999 | 406 |
| $35,000 to $49,999 | 820 |
| $50,000 to $74,999 | 1,021 |
| $75,000 to $99,999 | 557 |
| $100,000 to $149,999 | 435 |
| $150,000 to $199,999 | 76 |
| $200,000 or more | 6 |
| Median household income (dollars) | 47,448 |
Housing characteristics in MARYSVILLE, CA
| Total housing units | 4,967 |
| Occupied housing units | 4,592 |
| Vacant housing units | 375 |
| Total housing units | 4,967 |
| 1-unit, detached | 2,629 |
| 1-unit, attached | 257 |
| 2 units | 309 |
| 3 or 4 units | 537 |
| 5 to 9 units | 486 |
| 10 to 19 units | 144 |
| 20 or more units | 605 |
| Mobile home | 0 |
| Boat, RV, van, etc. | 0 |
| Total housing units | 4,967 |
| Built 2014 or later | 0 |
| Built 2010 to 2013 | 70 |
| Built 2000 to 2009 | 105 |
| Built 1990 to 1999 | 297 |
| Built 1980 to 1989 | 518 |
| Built 1970 to 1979 | 1,158 |
| Built 1960 to 1969 | 931 |
| Built 1950 to 1959 | 789 |
| Built 1940 to 1949 | 420 |
| Built 1939 or earlier | 679 |
| Total housing units | 4,967 |
| 1 room | 150 |
| 2 rooms | 194 |
| 3 rooms | 884 |
| 4 rooms | 1,212 |
| 5 rooms | 1,049 |
| 6 rooms | 775 |
| 7 rooms | 393 |
| 8 rooms | 180 |
| 9 rooms or more | 130 |
| Median rooms | 4.5 |
| Total housing units | 4,967 |
| No bedroom | 162 |
| 1 bedroom | 831 |
| 2 bedrooms | 1,835 |
| 3 bedrooms | 1,644 |
| 4 bedrooms | 431 |
| 5 or more bedrooms | 64 |
| Occupied housing units | 4,592 |
| Owner-occupied | 1,811 |
| Renter-occupied | 2,781 |
| Average household size of owner-occupied unit | 2.89 |
| Average household size of renter-occupied unit | 2.32 |
| Occupied housing units | 4,592 |
| Moved in 2017 or later | 182 |
| Moved in 2015 to 2016 | 931 |
| Moved in 2010 to 2014 | 1,732 |
| Moved in 2000 to 2009 | 871 |
| Moved in 1990 to 1999 | 380 |
| Moved in 1989 and earlier | 496 |
| Owner-occupied units | 1,811 |
| Less than $50,000 | 13 |
| $50,000 to $99,999 | 196 |
| $100,000 to $149,999 | 346 |
| $150,000 to $199,999 | 608 |
| $200,000 to $299,999 | 437 |
| $300,000 to $499,999 | 160 |
| $500,000 to $999,999 | 51 |
| $1,000,000 or more | 0 |
| Median (dollars) | 170,400 |
| Owner-occupied units | 1,811 |
| Housing units with a mortgage | 1,204 |
| Housing units without a mortgage | 607 |
| Occupied units paying rent | 2,649 |
| Less than $500 | 218 |
| $500 to $999 | 1,449 |
| $1,000 to $1,499 | 779 |
| $1,500 to $1,999 | 189 |
| $2,000 to $2,499 | 5 |
| $2,500 to $2,999 | 0 |
| $3,000 or more | 9 |
| Median (dollars) | 916 |
| No rent paid | 132 |
Data is based on 2018 Census
ZIP Codes for other locations
State for MARYSVILLE
California ZIP CodesOther cities in California