MENLO PARK, CA ZIP Code
| City | MENLO PARK |
| State | California |
| ZIP Codes count | 4 (see all) |
| Post offices count | 3 (see all) |
| Total population | 33,869 (see all) |
ZIP Codes in MENLO PARK, California
The ZIP Codes in MENLO PARK, California fall within the range from 94025 to 94028. MENLO PARK is covered by 4 ZIP Codes: 3 Standard and 1 PO Box. Below is the complete list:
94025, 94026, 94027, 94028
This list contains only 5-digit ZIP codes. Use our zip code lookup by address feature to get the full 9-digit (ZIP+4) code.
List of MENLO PARK, CA ZIP Codes
| ZIP | TYPE | POPU |
|---|---|---|
| 94025 | STANDARD | 41,826 |
| 94026 | PO BOX | – |
| 94027 | STANDARD | 7,213 |
| 94028 | STANDARD | 6,582 |
Post offices
MENLO PARK — Post Office™ 3875 BOHANNON DR MENLO PARK, CA 94025-1001 |
OAK GROVE — Post Office™ 655 OAK GROVE AVE MENLO PARK, CA 94025-9991 |
WEST MENLO PARK — Post Office™ 2120 AVY AVE MENLO PARK, CA 94025-9992 |
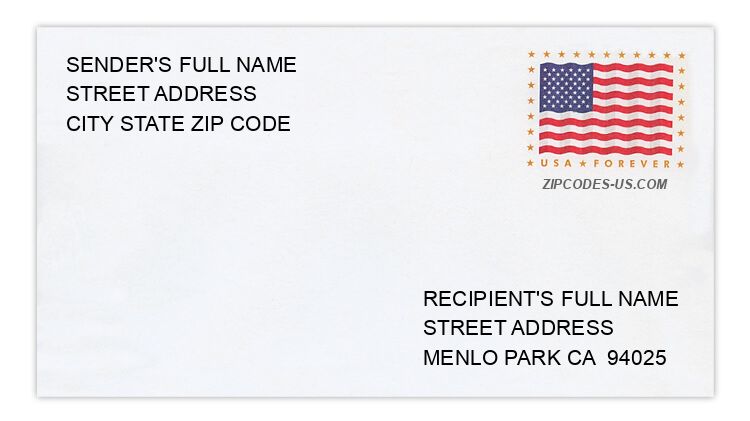
Envelope example
On the bottom center of the envelope, write the address you want your letter delivered to. Include the following on separate lines:
- Recipient's full name
- Full street address
- City, State, and ZIP Code
Using the same format, write the return address in the top left corner.
Using the full ZIP+4 Code when mailing via the USPS ensures the fastest, most accurate mailing possible. If you are not sure of the full 9-digit ZIP Code, use the 5-digit ZIP Code to avoid loss of letter or package.
The recipient address information is provided for your reference.
Address example
841 BLAKE ST
MENLO PARK CA 94025-4815
MENLO PARK CA 94025-4815
647 HERMOSA WAY
MENLO PARK CA 94025-5619
MENLO PARK CA 94025-5619
2031 SHARON RD
MENLO PARK CA 94025-6246
MENLO PARK CA 94025-6246
479 SHERWOOD WAY
MENLO PARK CA 94025-3715
MENLO PARK CA 94025-3715
70 VASILAKOS WAY
MENLO PARK CA 94025-5950
MENLO PARK CA 94025-5950
68 WILLOW PL
MENLO PARK CA 94025-3601
MENLO PARK CA 94025-3601
Map
Hover over the map to see the ZIP code
Census data for MENLO PARK, CA
Demographic and housing estimates in MENLO PARK, CA
| Total population | 33,869 |
| Male | 16,436 |
| Female | 17,433 |
| Total population | 33,869 |
| Under 5 years | 2,614 |
| 5 to 9 years | 2,610 |
| 10 to 14 years | 2,297 |
| 15 to 19 years | 1,428 |
| 20 to 24 years | 1,918 |
| 25 to 34 years | 4,714 |
| 35 to 44 years | 4,548 |
| 45 to 54 years | 4,706 |
| 55 to 59 years | 2,247 |
| 60 to 64 years | 2,032 |
| 65 to 74 years | 2,391 |
| 75 to 84 years | 1,477 |
| 85 years and over | 887 |
| Median age (years) | 37.7 |
| Under 18 years | 8,394 |
| 16 years and over | 26,156 |
| 18 years and over | 25,475 |
| 21 years and over | 24,700 |
| 62 years and over | 5,932 |
| 65 years and over | 4,755 |
| Total population | 33,869 |
| One race | 32,048 |
| White | 23,237 |
| Black or African American | 1,549 |
| American Indian and Alaska Native | 288 |
| Asian | 4,584 |
| Native Hawaiian and Other Pacific Islander | 419 |
| Some other race | 1,971 |
| Two or more races | 1,821 |
| Citizen, VOTING AGE 18 and over population | 21,407 |
| Male Citizen, VOTING AGE 18 and over population | 10,359 |
| Female Citizen, VOTING AGE 18 and over population | 11,048 |
Social characteristics in MENLO PARK, CA
| Total households | 11,936 |
| Family households (families) | 7,995 |
| Married-couple family | 6,640 |
| Male householder, no wife present, family | 301 |
| Female householder, no husband present, family | 1,054 |
| Nonfamily households | 3,941 |
| Average household size | 2.75 |
| Average family size | 3.29 |
Economic characteristics in MENLO PARK, CA
| Total households | 11,936 |
| Less than $10,000 | 425 |
| $10,000 to $14,999 | 357 |
| $15,000 to $24,999 | 456 |
| $25,000 to $34,999 | 331 |
| $35,000 to $49,999 | 774 |
| $50,000 to $74,999 | 1,259 |
| $75,000 to $99,999 | 871 |
| $100,000 to $149,999 | 1,589 |
| $150,000 to $199,999 | 1,337 |
| $200,000 or more | 4,537 |
| Median household income (dollars) | 147,824 |
Housing characteristics in MENLO PARK, CA
| Total housing units | 12,869 |
| Occupied housing units | 11,936 |
| Vacant housing units | 933 |
| Total housing units | 12,869 |
| 1-unit, detached | 7,308 |
| 1-unit, attached | 770 |
| 2 units | 417 |
| 3 or 4 units | 916 |
| 5 to 9 units | 1,173 |
| 10 to 19 units | 731 |
| 20 or more units | 1,486 |
| Mobile home | 0 |
| Boat, RV, van, etc. | 68 |
| Total housing units | 12,869 |
| Built 2014 or later | 201 |
| Built 2010 to 2013 | 245 |
| Built 2000 to 2009 | 466 |
| Built 1990 to 1999 | 610 |
| Built 1980 to 1989 | 689 |
| Built 1970 to 1979 | 1,903 |
| Built 1960 to 1969 | 2,098 |
| Built 1950 to 1959 | 3,900 |
| Built 1940 to 1949 | 1,881 |
| Built 1939 or earlier | 876 |
| Total housing units | 12,869 |
| 1 room | 383 |
| 2 rooms | 418 |
| 3 rooms | 1,850 |
| 4 rooms | 2,363 |
| 5 rooms | 2,204 |
| 6 rooms | 1,743 |
| 7 rooms | 1,464 |
| 8 rooms | 924 |
| 9 rooms or more | 1,520 |
| Median rooms | 5.1 |
| Total housing units | 12,869 |
| No bedroom | 422 |
| 1 bedroom | 1,872 |
| 2 bedrooms | 3,530 |
| 3 bedrooms | 3,871 |
| 4 bedrooms | 2,480 |
| 5 or more bedrooms | 694 |
| Occupied housing units | 11,936 |
| Owner-occupied | 6,992 |
| Renter-occupied | 4,944 |
| Average household size of owner-occupied unit | 2.93 |
| Average household size of renter-occupied unit | 2.51 |
| Occupied housing units | 11,936 |
| Moved in 2017 or later | 568 |
| Moved in 2015 to 2016 | 1,323 |
| Moved in 2010 to 2014 | 3,664 |
| Moved in 2000 to 2009 | 2,721 |
| Moved in 1990 to 1999 | 1,717 |
| Moved in 1989 and earlier | 1,943 |
| Owner-occupied units | 6,992 |
| Less than $50,000 | 72 |
| $50,000 to $99,999 | 0 |
| $100,000 to $149,999 | 0 |
| $150,000 to $199,999 | 37 |
| $200,000 to $299,999 | 43 |
| $300,000 to $499,999 | 157 |
| $500,000 to $999,999 | 996 |
| $1,000,000 or more | 5,687 |
| Median (dollars) | 2,000,001 |
| Owner-occupied units | 6,992 |
| Housing units with a mortgage | 4,871 |
| Housing units without a mortgage | 2,121 |
| Occupied units paying rent | 4,757 |
| Less than $500 | 188 |
| $500 to $999 | 200 |
| $1,000 to $1,499 | 478 |
| $1,500 to $1,999 | 972 |
| $2,000 to $2,499 | 1,066 |
| $2,500 to $2,999 | 684 |
| $3,000 or more | 1,169 |
| Median (dollars) | 2,254 |
| No rent paid | 187 |
Data is based on 2018 Census
ZIP Codes for other locations
State for MENLO PARK
California ZIP CodesOther cities in California