MOORPARK, CA ZIP Code
| City | MOORPARK |
| State | California |
| ZIP Codes count | 2 (see all) |
| Post offices count | 1 (see all) |
| Total population | 36,274 (see all) |
ZIP Codes in MOORPARK, California
93020, 93021
This list contains only 5-digit ZIP codes. Use our zip code lookup by address feature to get the full 9-digit (ZIP+4) code.
List of MOORPARK, CA ZIP Codes
| ZIP | TYPE | POPU |
|---|---|---|
| 93020 | PO BOX | – |
| 93021 | STANDARD | 38,030 |
Post offices
MOORPARK — Post Office™ 100 W HIGH ST MOORPARK, CA 93021-1113 |
Envelope example
On the bottom center of the envelope, write the address you want your letter delivered to. Include the following on separate lines:
- Recipient's full name
- Full street address
- City, State, and ZIP Code
Using the same format, write the return address in the top left corner.
Using the full ZIP+4 Code when mailing via the USPS ensures the fastest, most accurate mailing possible. If you are not sure of the full 9-digit ZIP Code, use the 5-digit ZIP Code to avoid loss of letter or package.
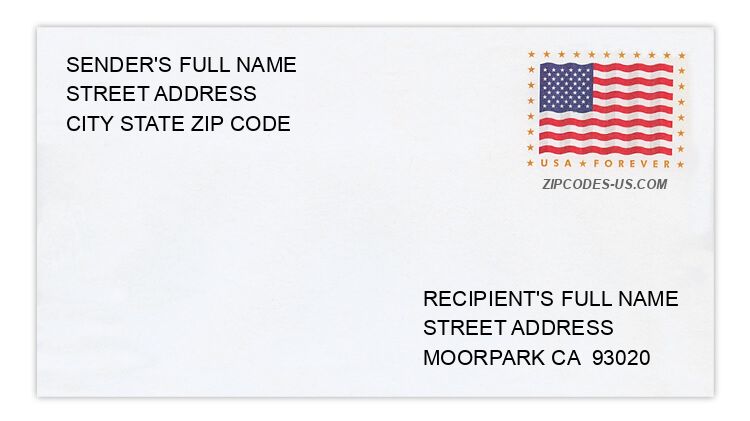
The recipient address information is provided for your reference.
Address example
8336 FAIR OAKS
MOORPARK CA 93021-9704
MOORPARK CA 93021-9704
3859 HUNTERS GROVE CT
MOORPARK CA 93021-3161
MOORPARK CA 93021-3161
11897 NIGHTINGALE ST
MOORPARK CA 93021-2439
MOORPARK CA 93021-2439
13036 SILVER CREEK ST
MOORPARK CA 93021-2920
MOORPARK CA 93021-2920
15782 SWIFT PL
MOORPARK CA 93021-3232
MOORPARK CA 93021-3232
6932 TULANE AVE
MOORPARK CA 93021-1326
MOORPARK CA 93021-1326
Map
Hover over the map to see the ZIP code
Census data for MOORPARK, CA
Demographic and housing estimates in MOORPARK, CA
| Total population | 36,274 |
| Male | 17,446 |
| Female | 18,828 |
| Total population | 36,274 |
| Under 5 years | 2,294 |
| 5 to 9 years | 1,852 |
| 10 to 14 years | 2,554 |
| 15 to 19 years | 2,676 |
| 20 to 24 years | 2,753 |
| 25 to 34 years | 4,813 |
| 35 to 44 years | 4,332 |
| 45 to 54 years | 5,156 |
| 55 to 59 years | 3,218 |
| 60 to 64 years | 2,258 |
| 65 to 74 years | 2,951 |
| 75 to 84 years | 890 |
| 85 years and over | 527 |
| Median age (years) | 37.6 |
| Under 18 years | 8,362 |
| 16 years and over | 29,104 |
| 18 years and over | 27,912 |
| 21 years and over | 26,293 |
| 62 years and over | 5,497 |
| 65 years and over | 4,368 |
| Total population | 36,274 |
| One race | 33,915 |
| White | 27,790 |
| Black or African American | 594 |
| American Indian and Alaska Native | 348 |
| Asian | 2,934 |
| Native Hawaiian and Other Pacific Islander | 259 |
| Some other race | 1,990 |
| Two or more races | 2,359 |
| Citizen, VOTING AGE 18 and over population | 25,700 |
| Male Citizen, VOTING AGE 18 and over population | 12,344 |
| Female Citizen, VOTING AGE 18 and over population | 13,356 |
Social characteristics in MOORPARK, CA
| Total households | 11,282 |
| Family households (families) | 9,260 |
| Married-couple family | 7,902 |
| Male householder, no wife present, family | 467 |
| Female householder, no husband present, family | 891 |
| Nonfamily households | 2,022 |
| Average household size | 3.22 |
| Average family size | 3.56 |
Economic characteristics in MOORPARK, CA
| Total households | 11,282 |
| Less than $10,000 | 190 |
| $10,000 to $14,999 | 135 |
| $15,000 to $24,999 | 338 |
| $25,000 to $34,999 | 499 |
| $35,000 to $49,999 | 915 |
| $50,000 to $74,999 | 1,488 |
| $75,000 to $99,999 | 1,594 |
| $100,000 to $149,999 | 2,283 |
| $150,000 to $199,999 | 1,449 |
| $200,000 or more | 2,391 |
| Median household income (dollars) | 104,839 |
Housing characteristics in MOORPARK, CA
| Total housing units | 11,796 |
| Occupied housing units | 11,282 |
| Vacant housing units | 514 |
| Total housing units | 11,796 |
| 1-unit, detached | 8,473 |
| 1-unit, attached | 1,618 |
| 2 units | 58 |
| 3 or 4 units | 218 |
| 5 to 9 units | 415 |
| 10 to 19 units | 426 |
| 20 or more units | 387 |
| Mobile home | 201 |
| Boat, RV, van, etc. | 0 |
| Total housing units | 11,796 |
| Built 2014 or later | 292 |
| Built 2010 to 2013 | 40 |
| Built 2000 to 2009 | 1,878 |
| Built 1990 to 1999 | 1,522 |
| Built 1980 to 1989 | 5,559 |
| Built 1970 to 1979 | 1,325 |
| Built 1960 to 1969 | 323 |
| Built 1950 to 1959 | 584 |
| Built 1940 to 1949 | 189 |
| Built 1939 or earlier | 84 |
| Total housing units | 11,796 |
| 1 room | 58 |
| 2 rooms | 146 |
| 3 rooms | 532 |
| 4 rooms | 1,398 |
| 5 rooms | 1,802 |
| 6 rooms | 2,181 |
| 7 rooms | 1,893 |
| 8 rooms | 1,850 |
| 9 rooms or more | 1,936 |
| Median rooms | 6.4 |
| Total housing units | 11,796 |
| No bedroom | 66 |
| 1 bedroom | 449 |
| 2 bedrooms | 1,765 |
| 3 bedrooms | 4,243 |
| 4 bedrooms | 3,831 |
| 5 or more bedrooms | 1,442 |
| Occupied housing units | 11,282 |
| Owner-occupied | 8,580 |
| Renter-occupied | 2,702 |
| Average household size of owner-occupied unit | 3.27 |
| Average household size of renter-occupied unit | 3.03 |
| Occupied housing units | 11,282 |
| Moved in 2017 or later | 316 |
| Moved in 2015 to 2016 | 1,296 |
| Moved in 2010 to 2014 | 2,639 |
| Moved in 2000 to 2009 | 3,508 |
| Moved in 1990 to 1999 | 1,912 |
| Moved in 1989 and earlier | 1,611 |
| Owner-occupied units | 8,580 |
| Less than $50,000 | 131 |
| $50,000 to $99,999 | 94 |
| $100,000 to $149,999 | 86 |
| $150,000 to $199,999 | 44 |
| $200,000 to $299,999 | 205 |
| $300,000 to $499,999 | 1,927 |
| $500,000 to $999,999 | 5,532 |
| $1,000,000 or more | 561 |
| Median (dollars) | 621,200 |
| Owner-occupied units | 8,580 |
| Housing units with a mortgage | 6,871 |
| Housing units without a mortgage | 1,709 |
| Occupied units paying rent | 2,546 |
| Less than $500 | 70 |
| $500 to $999 | 76 |
| $1,000 to $1,499 | 455 |
| $1,500 to $1,999 | 821 |
| $2,000 to $2,499 | 645 |
| $2,500 to $2,999 | 264 |
| $3,000 or more | 215 |
| Median (dollars) | 1,909 |
| No rent paid | 156 |
Data is based on 2018 Census
ZIP Codes for other locations
State for MOORPARK
California ZIP CodesOther cities in California