NIPOMO, CA ZIP Code
| City | NIPOMO |
| State | California |
| ZIP Codes count | 1 (see all) |
| Post offices count | 1 (see all) |
| Total population | 17,445 (see all) |
ZIP Code in NIPOMO, California
93444
This list contains only 5-digit ZIP codes. Use our zip code lookup by address feature to get the full 9-digit (ZIP+4) code.
List of NIPOMO, CA ZIP Codes
| ZIP | TYPE | POPU |
|---|---|---|
| 93444 | STANDARD | 22,032 |
Post offices
NIPOMO — Post Office™ 630 W TEFFT ST NIPOMO, CA 93444-9998 |
Envelope example
On the bottom center of the envelope, write the address you want your letter delivered to. Include the following on separate lines:
- Recipient's full name
- Full street address
- City, State, and ZIP Code
Using the same format, write the return address in the top left corner.
Using the full ZIP+4 Code when mailing via the USPS ensures the fastest, most accurate mailing possible. If you are not sure of the full 9-digit ZIP Code, use the 5-digit ZIP Code to avoid loss of letter or package.
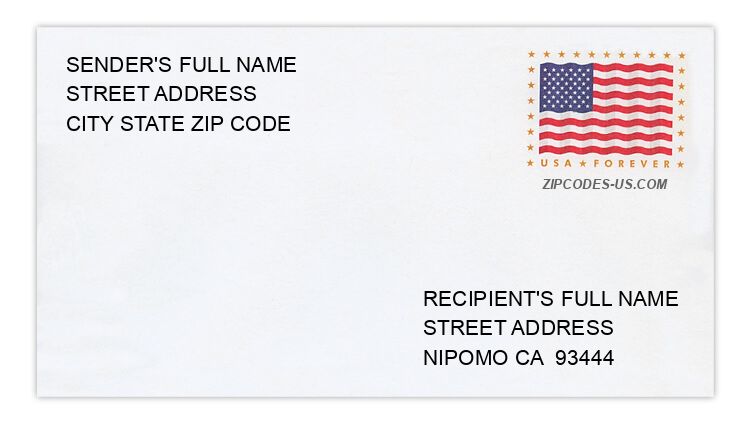
The recipient address information is provided for your reference.
Address example
1488 GRACE LN
NIPOMO CA 93444-9469
NIPOMO CA 93444-9469
919 JORDAN CT
NIPOMO CA 93444-6625
NIPOMO CA 93444-6625
280 LEMA DR
NIPOMO CA 93444-9538
NIPOMO CA 93444-9538
538 NAZARIO CT
NIPOMO CA 93444-8972
NIPOMO CA 93444-8972
367 TYRUS CT
NIPOMO CA 93444-9608
NIPOMO CA 93444-9608
375 VIA PROMESA
NIPOMO CA 93444-9587
NIPOMO CA 93444-9587
Map
Hover over the map to see the ZIP code
Census data for NIPOMO, CA
Demographic and housing estimates in NIPOMO, CA
| Total population | 17,445 |
| Male | 8,973 |
| Female | 8,472 |
| Total population | 17,445 |
| Under 5 years | 772 |
| 5 to 9 years | 971 |
| 10 to 14 years | 1,227 |
| 15 to 19 years | 1,253 |
| 20 to 24 years | 1,401 |
| 25 to 34 years | 1,819 |
| 35 to 44 years | 2,321 |
| 45 to 54 years | 2,236 |
| 55 to 59 years | 1,360 |
| 60 to 64 years | 1,176 |
| 65 to 74 years | 2,117 |
| 75 to 84 years | 640 |
| 85 years and over | 152 |
| Median age (years) | 40.1 |
| Under 18 years | 3,846 |
| 16 years and over | 14,273 |
| 18 years and over | 13,599 |
| 21 years and over | 12,959 |
| 62 years and over | 3,684 |
| 65 years and over | 2,909 |
| Total population | 17,445 |
| One race | 16,853 |
| White | 14,983 |
| Black or African American | 267 |
| American Indian and Alaska Native | 54 |
| Asian | 557 |
| Native Hawaiian and Other Pacific Islander | 0 |
| Some other race | 992 |
| Two or more races | 592 |
| Citizen, VOTING AGE 18 and over population | 11,973 |
| Male Citizen, VOTING AGE 18 and over population | 6,168 |
| Female Citizen, VOTING AGE 18 and over population | 5,805 |
Social characteristics in NIPOMO, CA
| Total households | 5,664 |
| Family households (families) | 4,556 |
| Married-couple family | 3,461 |
| Male householder, no wife present, family | 413 |
| Female householder, no husband present, family | 682 |
| Nonfamily households | 1,108 |
| Average household size | 3.08 |
| Average family size | 3.36 |
Economic characteristics in NIPOMO, CA
| Total households | 5,664 |
| Less than $10,000 | 290 |
| $10,000 to $14,999 | 202 |
| $15,000 to $24,999 | 271 |
| $25,000 to $34,999 | 274 |
| $35,000 to $49,999 | 536 |
| $50,000 to $74,999 | 1,137 |
| $75,000 to $99,999 | 718 |
| $100,000 to $149,999 | 1,271 |
| $150,000 to $199,999 | 453 |
| $200,000 or more | 512 |
| Median household income (dollars) | 77,460 |
Housing characteristics in NIPOMO, CA
| Total housing units | 5,988 |
| Occupied housing units | 5,664 |
| Vacant housing units | 324 |
| Total housing units | 5,988 |
| 1-unit, detached | 4,461 |
| 1-unit, attached | 198 |
| 2 units | 71 |
| 3 or 4 units | 248 |
| 5 to 9 units | 133 |
| 10 to 19 units | 90 |
| 20 or more units | 61 |
| Mobile home | 726 |
| Boat, RV, van, etc. | 0 |
| Total housing units | 5,988 |
| Built 2014 or later | 0 |
| Built 2010 to 2013 | 170 |
| Built 2000 to 2009 | 1,673 |
| Built 1990 to 1999 | 1,029 |
| Built 1980 to 1989 | 1,242 |
| Built 1970 to 1979 | 925 |
| Built 1960 to 1969 | 628 |
| Built 1950 to 1959 | 145 |
| Built 1940 to 1949 | 13 |
| Built 1939 or earlier | 163 |
| Total housing units | 5,988 |
| 1 room | 132 |
| 2 rooms | 0 |
| 3 rooms | 471 |
| 4 rooms | 773 |
| 5 rooms | 1,584 |
| 6 rooms | 1,254 |
| 7 rooms | 826 |
| 8 rooms | 459 |
| 9 rooms or more | 489 |
| Median rooms | 5.5 |
| Total housing units | 5,988 |
| No bedroom | 155 |
| 1 bedroom | 130 |
| 2 bedrooms | 1,047 |
| 3 bedrooms | 3,348 |
| 4 bedrooms | 1,099 |
| 5 or more bedrooms | 209 |
| Occupied housing units | 5,664 |
| Owner-occupied | 4,062 |
| Renter-occupied | 1,602 |
| Average household size of owner-occupied unit | 3.07 |
| Average household size of renter-occupied unit | 3.08 |
| Occupied housing units | 5,664 |
| Moved in 2017 or later | 235 |
| Moved in 2015 to 2016 | 411 |
| Moved in 2010 to 2014 | 1,780 |
| Moved in 2000 to 2009 | 1,652 |
| Moved in 1990 to 1999 | 887 |
| Moved in 1989 and earlier | 699 |
| Owner-occupied units | 4,062 |
| Less than $50,000 | 29 |
| $50,000 to $99,999 | 76 |
| $100,000 to $149,999 | 47 |
| $150,000 to $199,999 | 107 |
| $200,000 to $299,999 | 632 |
| $300,000 to $499,999 | 1,140 |
| $500,000 to $999,999 | 1,871 |
| $1,000,000 or more | 160 |
| Median (dollars) | 500,000 |
| Owner-occupied units | 4,062 |
| Housing units with a mortgage | 2,954 |
| Housing units without a mortgage | 1,108 |
| Occupied units paying rent | 1,536 |
| Less than $500 | 86 |
| $500 to $999 | 270 |
| $1,000 to $1,499 | 435 |
| $1,500 to $1,999 | 354 |
| $2,000 to $2,499 | 361 |
| $2,500 to $2,999 | 30 |
| $3,000 or more | 0 |
| Median (dollars) | 1,478 |
| No rent paid | 66 |
Data is based on 2018 Census
ZIP Codes for other locations
State for NIPOMO
California ZIP CodesOther cities in California