ORLAND, CA ZIP Code
| City | ORLAND |
| State | California |
| ZIP Codes count | 1 (see all) |
| Post offices count | 1 (see all) |
| Total population | 7,541 (see all) |
ZIP Code in ORLAND, California
95963
This list contains only 5-digit ZIP codes. Use our zip code lookup by address feature to get the full 9-digit (ZIP+4) code.
List of ORLAND, CA ZIP Codes
| ZIP | TYPE | POPU |
|---|---|---|
| 95963 | STANDARD | 16,812 |
Post offices
ORLAND — Post Office™ 831 4TH ST ORLAND, CA 95963-9998 |
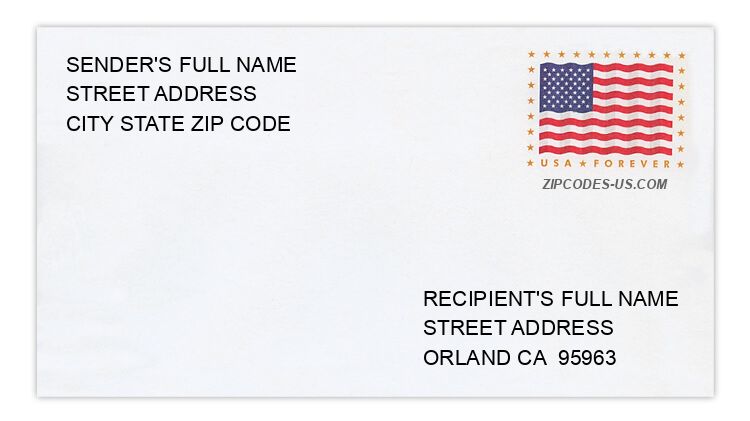
Envelope example
On the bottom center of the envelope, write the address you want your letter delivered to. Include the following on separate lines:
- Recipient's full name
- Full street address
- City, State, and ZIP Code
Using the same format, write the return address in the top left corner.
Using the full ZIP+4 Code when mailing via the USPS ensures the fastest, most accurate mailing possible. If you are not sure of the full 9-digit ZIP Code, use the 5-digit ZIP Code to avoid loss of letter or package.
The recipient address information is provided for your reference.
Address example
229 2ND AVE
ORLAND CA 95963-9505
ORLAND CA 95963-9505
6967 COUNTY ROAD 16
ORLAND CA 95963-9131
ORLAND CA 95963-9131
4784 COUNTY ROAD L
ORLAND CA 95963-8117
ORLAND CA 95963-8117
7241 CUTLER AVE
ORLAND CA 95963-9688
ORLAND CA 95963-9688
6346 PATRICIA LN
ORLAND CA 95963-9200
ORLAND CA 95963-9200
819 SOUTH ST
ORLAND CA 95963-1666
ORLAND CA 95963-1666
Map
Hover over the map to see the ZIP code
Census data for ORLAND, CA
Demographic and housing estimates in ORLAND, CA
| Total population | 7,541 |
| Male | 3,789 |
| Female | 3,752 |
| Total population | 7,541 |
| Under 5 years | 829 |
| 5 to 9 years | 417 |
| 10 to 14 years | 724 |
| 15 to 19 years | 583 |
| 20 to 24 years | 576 |
| 25 to 34 years | 1,283 |
| 35 to 44 years | 900 |
| 45 to 54 years | 631 |
| 55 to 59 years | 253 |
| 60 to 64 years | 420 |
| 65 to 74 years | 593 |
| 75 to 84 years | 212 |
| 85 years and over | 120 |
| Median age (years) | 28.7 |
| Under 18 years | 2,379 |
| 16 years and over | 5,451 |
| 18 years and over | 5,162 |
| 21 years and over | 4,927 |
| 62 years and over | 1,270 |
| 65 years and over | 925 |
| Total population | 7,541 |
| One race | 7,455 |
| White | 6,400 |
| Black or African American | 2 |
| American Indian and Alaska Native | 158 |
| Asian | 150 |
| Native Hawaiian and Other Pacific Islander | 0 |
| Some other race | 745 |
| Two or more races | 86 |
| Citizen, VOTING AGE 18 and over population | 3,941 |
| Male Citizen, VOTING AGE 18 and over population | 1,917 |
| Female Citizen, VOTING AGE 18 and over population | 2,024 |
Social characteristics in ORLAND, CA
| Total households | 2,539 |
| Family households (families) | 2,096 |
| Married-couple family | 1,418 |
| Male householder, no wife present, family | 147 |
| Female householder, no husband present, family | 531 |
| Nonfamily households | 443 |
| Average household size | 2.96 |
| Average family size | 3.24 |
Economic characteristics in ORLAND, CA
| Total households | 2,539 |
| Less than $10,000 | 226 |
| $10,000 to $14,999 | 297 |
| $15,000 to $24,999 | 366 |
| $25,000 to $34,999 | 203 |
| $35,000 to $49,999 | 341 |
| $50,000 to $74,999 | 595 |
| $75,000 to $99,999 | 212 |
| $100,000 to $149,999 | 266 |
| $150,000 to $199,999 | 33 |
| $200,000 or more | 0 |
| Median household income (dollars) | 43,914 |
Housing characteristics in ORLAND, CA
| Total housing units | 2,666 |
| Occupied housing units | 2,539 |
| Vacant housing units | 127 |
| Total housing units | 2,666 |
| 1-unit, detached | 1,930 |
| 1-unit, attached | 105 |
| 2 units | 116 |
| 3 or 4 units | 76 |
| 5 to 9 units | 180 |
| 10 to 19 units | 141 |
| 20 or more units | 22 |
| Mobile home | 51 |
| Boat, RV, van, etc. | 45 |
| Total housing units | 2,666 |
| Built 2014 or later | 0 |
| Built 2010 to 2013 | 270 |
| Built 2000 to 2009 | 185 |
| Built 1990 to 1999 | 218 |
| Built 1980 to 1989 | 404 |
| Built 1970 to 1979 | 580 |
| Built 1960 to 1969 | 256 |
| Built 1950 to 1959 | 363 |
| Built 1940 to 1949 | 170 |
| Built 1939 or earlier | 220 |
| Total housing units | 2,666 |
| 1 room | 13 |
| 2 rooms | 65 |
| 3 rooms | 264 |
| 4 rooms | 723 |
| 5 rooms | 787 |
| 6 rooms | 374 |
| 7 rooms | 249 |
| 8 rooms | 58 |
| 9 rooms or more | 133 |
| Median rooms | 4.8 |
| Total housing units | 2,666 |
| No bedroom | 13 |
| 1 bedroom | 243 |
| 2 bedrooms | 970 |
| 3 bedrooms | 1,192 |
| 4 bedrooms | 214 |
| 5 or more bedrooms | 34 |
| Occupied housing units | 2,539 |
| Owner-occupied | 1,235 |
| Renter-occupied | 1,304 |
| Average household size of owner-occupied unit | 2.89 |
| Average household size of renter-occupied unit | 3.04 |
| Occupied housing units | 2,539 |
| Moved in 2017 or later | 79 |
| Moved in 2015 to 2016 | 454 |
| Moved in 2010 to 2014 | 950 |
| Moved in 2000 to 2009 | 435 |
| Moved in 1990 to 1999 | 254 |
| Moved in 1989 and earlier | 367 |
| Owner-occupied units | 1,235 |
| Less than $50,000 | 43 |
| $50,000 to $99,999 | 41 |
| $100,000 to $149,999 | 147 |
| $150,000 to $199,999 | 389 |
| $200,000 to $299,999 | 418 |
| $300,000 to $499,999 | 191 |
| $500,000 to $999,999 | 6 |
| $1,000,000 or more | 0 |
| Median (dollars) | 199,600 |
| Owner-occupied units | 1,235 |
| Housing units with a mortgage | 584 |
| Housing units without a mortgage | 651 |
| Occupied units paying rent | 1,304 |
| Less than $500 | 116 |
| $500 to $999 | 766 |
| $1,000 to $1,499 | 395 |
| $1,500 to $1,999 | 27 |
| $2,000 to $2,499 | 0 |
| $2,500 to $2,999 | 0 |
| $3,000 or more | 0 |
| Median (dollars) | 879 |
| No rent paid | 0 |
Data is based on 2018 Census
ZIP Codes for other locations
State for ORLAND
California ZIP CodesOther cities in California