OROVILLE, CA ZIP Code
| City | OROVILLE |
| State | California |
| ZIP Codes count | 5 (see all) |
| Post offices count | 3 (see all) |
| Total population | 19,040 (see all) |
ZIP Codes in OROVILLE, California
The ZIP Codes in OROVILLE, California fall within the range from 95915 to 95980. OROVILLE is covered by 5 ZIP Codes: 2 Standard and 3 PO Box. Below is the complete list:
95915, 95940, 95965, 95966, 95980
This list contains only 5-digit ZIP codes. Use our zip code lookup by address feature to get the full 9-digit (ZIP+4) code.
List of OROVILLE, CA ZIP Codes
| ZIP | TYPE | POPU |
|---|---|---|
| 95915 | PO BOX | 0 |
| 95940 | PO BOX | – |
| 95965 | STANDARD | 21,891 |
| 95966 | STANDARD | 29,203 |
| 95980 | PO BOX | – |
Post offices
OPHIR — Post Office™ 2359 MYERS ST STE D OROVILLE, CA 95966-9998 |
OROVILLE — Post Office™ 1735 ROBINSON ST OROVILLE, CA 95965-9998 |
QUINCY — Post Office™ 222 LAWRENCE ST QUINCY, CA 95971-9998 |
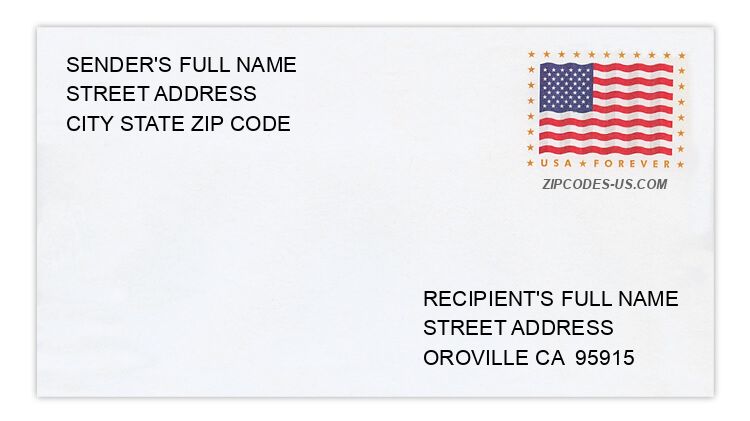
Envelope example
On the bottom center of the envelope, write the address you want your letter delivered to. Include the following on separate lines:
- Recipient's full name
- Full street address
- City, State, and ZIP Code
Using the same format, write the return address in the top left corner.
Using the full ZIP+4 Code when mailing via the USPS ensures the fastest, most accurate mailing possible. If you are not sure of the full 9-digit ZIP Code, use the 5-digit ZIP Code to avoid loss of letter or package.
The recipient address information is provided for your reference.
Address example
4117 BACKACHE RD
OROVILLE CA 95965-9786
OROVILLE CA 95965-9786
113 DUNSTONE DR
OROVILLE CA 95966-8007
OROVILLE CA 95966-8007
11048 FAITH RD
OROVILLE CA 95965-9729
OROVILLE CA 95965-9729
166 HIGH MEADOWS RD
OROVILLE CA 95965-8387
OROVILLE CA 95965-8387
1646 OAK ST
OROVILLE CA 95965-4829
OROVILLE CA 95965-4829
427 SANDRA LN
OROVILLE CA 95966-8985
OROVILLE CA 95966-8985
Map
Hover over the map to see the ZIP code
Census data for OROVILLE, CA
Demographic and housing estimates in OROVILLE, CA
| Total population | 19,040 |
| Male | 9,673 |
| Female | 9,367 |
| Total population | 19,040 |
| Under 5 years | 1,605 |
| 5 to 9 years | 1,431 |
| 10 to 14 years | 1,093 |
| 15 to 19 years | 1,101 |
| 20 to 24 years | 1,694 |
| 25 to 34 years | 2,888 |
| 35 to 44 years | 2,014 |
| 45 to 54 years | 1,897 |
| 55 to 59 years | 1,270 |
| 60 to 64 years | 1,102 |
| 65 to 74 years | 1,453 |
| 75 to 84 years | 1,080 |
| 85 years and over | 412 |
| Median age (years) | 33.8 |
| Under 18 years | 4,783 |
| 16 years and over | 14,743 |
| 18 years and over | 14,257 |
| 21 years and over | 13,410 |
| 62 years and over | 3,490 |
| 65 years and over | 2,945 |
| Total population | 19,040 |
| One race | 16,630 |
| White | 12,779 |
| Black or African American | 919 |
| American Indian and Alaska Native | 399 |
| Asian | 2,005 |
| Native Hawaiian and Other Pacific Islander | 57 |
| Some other race | 471 |
| Two or more races | 2,410 |
| Citizen, VOTING AGE 18 and over population | 13,820 |
| Male Citizen, VOTING AGE 18 and over population | 7,059 |
| Female Citizen, VOTING AGE 18 and over population | 6,761 |
Social characteristics in OROVILLE, CA
| Total households | 6,204 |
| Family households (families) | 3,713 |
| Married-couple family | 2,268 |
| Male householder, no wife present, family | 252 |
| Female householder, no husband present, family | 1,193 |
| Nonfamily households | 2,491 |
| Average household size | 2.79 |
| Average family size | 3.60 |
Economic characteristics in OROVILLE, CA
| Total households | 6,204 |
| Less than $10,000 | 557 |
| $10,000 to $14,999 | 523 |
| $15,000 to $24,999 | 1,145 |
| $25,000 to $34,999 | 898 |
| $35,000 to $49,999 | 870 |
| $50,000 to $74,999 | 1,098 |
| $75,000 to $99,999 | 585 |
| $100,000 to $149,999 | 392 |
| $150,000 to $199,999 | 60 |
| $200,000 or more | 76 |
| Median household income (dollars) | 34,712 |
Housing characteristics in OROVILLE, CA
| Total housing units | 7,069 |
| Occupied housing units | 6,204 |
| Vacant housing units | 865 |
| Total housing units | 7,069 |
| 1-unit, detached | 4,328 |
| 1-unit, attached | 348 |
| 2 units | 337 |
| 3 or 4 units | 483 |
| 5 to 9 units | 530 |
| 10 to 19 units | 248 |
| 20 or more units | 399 |
| Mobile home | 396 |
| Boat, RV, van, etc. | 0 |
| Total housing units | 7,069 |
| Built 2014 or later | 8 |
| Built 2010 to 2013 | 64 |
| Built 2000 to 2009 | 614 |
| Built 1990 to 1999 | 503 |
| Built 1980 to 1989 | 718 |
| Built 1970 to 1979 | 1,213 |
| Built 1960 to 1969 | 1,077 |
| Built 1950 to 1959 | 1,135 |
| Built 1940 to 1949 | 534 |
| Built 1939 or earlier | 1,203 |
| Total housing units | 7,069 |
| 1 room | 130 |
| 2 rooms | 310 |
| 3 rooms | 700 |
| 4 rooms | 1,714 |
| 5 rooms | 1,782 |
| 6 rooms | 1,470 |
| 7 rooms | 475 |
| 8 rooms | 326 |
| 9 rooms or more | 162 |
| Median rooms | 4.9 |
| Total housing units | 7,069 |
| No bedroom | 159 |
| 1 bedroom | 937 |
| 2 bedrooms | 2,495 |
| 3 bedrooms | 2,720 |
| 4 bedrooms | 656 |
| 5 or more bedrooms | 102 |
| Occupied housing units | 6,204 |
| Owner-occupied | 2,930 |
| Renter-occupied | 3,274 |
| Average household size of owner-occupied unit | 2.60 |
| Average household size of renter-occupied unit | 2.95 |
| Occupied housing units | 6,204 |
| Moved in 2017 or later | 249 |
| Moved in 2015 to 2016 | 1,050 |
| Moved in 2010 to 2014 | 2,109 |
| Moved in 2000 to 2009 | 1,424 |
| Moved in 1990 to 1999 | 612 |
| Moved in 1989 and earlier | 760 |
| Owner-occupied units | 2,930 |
| Less than $50,000 | 251 |
| $50,000 to $99,999 | 255 |
| $100,000 to $149,999 | 629 |
| $150,000 to $199,999 | 761 |
| $200,000 to $299,999 | 540 |
| $300,000 to $499,999 | 408 |
| $500,000 to $999,999 | 57 |
| $1,000,000 or more | 29 |
| Median (dollars) | 177,000 |
| Owner-occupied units | 2,930 |
| Housing units with a mortgage | 1,809 |
| Housing units without a mortgage | 1,121 |
| Occupied units paying rent | 3,149 |
| Less than $500 | 458 |
| $500 to $999 | 1,733 |
| $1,000 to $1,499 | 739 |
| $1,500 to $1,999 | 190 |
| $2,000 to $2,499 | 15 |
| $2,500 to $2,999 | 0 |
| $3,000 or more | 14 |
| Median (dollars) | 815 |
| No rent paid | 125 |
Data is based on 2018 Census
ZIP Codes for other locations
State for OROVILLE
California ZIP CodesOther cities in California