SELMA, CA ZIP Code
| City | SELMA |
| State | California |
| ZIP Codes count | 1 (see all) |
| Post offices count | 1 (see all) |
| Total population | 24,598 (see all) |
ZIP Code in SELMA, California
93662
This list contains only 5-digit ZIP codes. Use our zip code lookup by address feature to get the full 9-digit (ZIP+4) code.
List of SELMA, CA ZIP Codes
| ZIP | TYPE | POPU |
|---|---|---|
| 93662 | STANDARD | 30,123 |
Post offices
SELMA — Post Office™ 2058 HIGH ST SELMA, CA 93662-9998 |
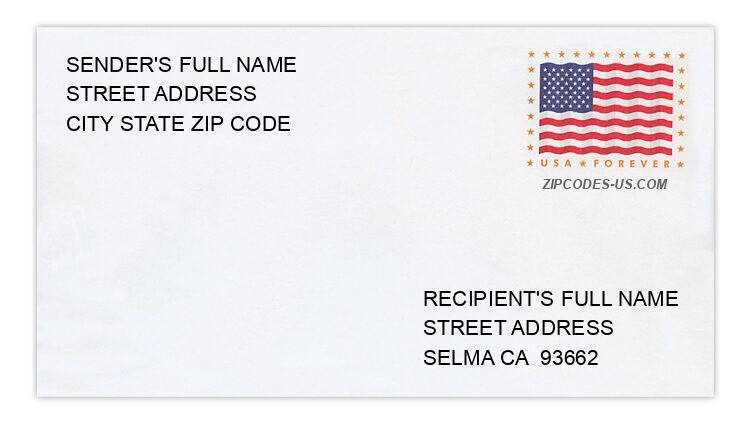
Envelope example
On the bottom center of the envelope, write the address you want your letter delivered to. Include the following on separate lines:
- Recipient's full name
- Full street address
- City, State, and ZIP Code
Using the same format, write the return address in the top left corner.
Using the full ZIP+4 Code when mailing via the USPS ensures the fastest, most accurate mailing possible. If you are not sure of the full 9-digit ZIP Code, use the 5-digit ZIP Code to avoid loss of letter or package.
The recipient address information is provided for your reference.
Address example
8698 E CORTLEY ST
SELMA CA 93662-2002
SELMA CA 93662-2002
7816 E SPRINGFIELD AVE
SELMA CA 93662-9408
SELMA CA 93662-9408
2771 FERN CT
SELMA CA 93662-3482
SELMA CA 93662-3482
3151 KENT ST
SELMA CA 93662-4335
SELMA CA 93662-4335
1399 LEWIS ST
SELMA CA 93662-2515
SELMA CA 93662-2515
3515 WOODROW ST
SELMA CA 93662-4501
SELMA CA 93662-4501
Map
Hover over the map to see the ZIP code
Census data for SELMA, CA
Demographic and housing estimates in SELMA, CA
| Total population | 24,598 |
| Male | 12,219 |
| Female | 12,379 |
| Total population | 24,598 |
| Under 5 years | 1,980 |
| 5 to 9 years | 2,157 |
| 10 to 14 years | 2,265 |
| 15 to 19 years | 1,827 |
| 20 to 24 years | 2,222 |
| 25 to 34 years | 3,564 |
| 35 to 44 years | 3,631 |
| 45 to 54 years | 2,169 |
| 55 to 59 years | 1,146 |
| 60 to 64 years | 1,156 |
| 65 to 74 years | 1,267 |
| 75 to 84 years | 875 |
| 85 years and over | 339 |
| Median age (years) | 29.4 |
| Under 18 years | 7,639 |
| 16 years and over | 17,683 |
| 18 years and over | 16,959 |
| 21 years and over | 15,967 |
| 62 years and over | 3,173 |
| 65 years and over | 2,481 |
| Total population | 24,598 |
| One race | 23,581 |
| White | 19,708 |
| Black or African American | 70 |
| American Indian and Alaska Native | 148 |
| Asian | 955 |
| Native Hawaiian and Other Pacific Islander | 245 |
| Some other race | 2,455 |
| Two or more races | 1,017 |
| Citizen, VOTING AGE 18 and over population | 12,820 |
| Male Citizen, VOTING AGE 18 and over population | 6,108 |
| Female Citizen, VOTING AGE 18 and over population | 6,712 |
Social characteristics in SELMA, CA
| Total households | 6,756 |
| Family households (families) | 5,357 |
| Married-couple family | 3,490 |
| Male householder, no wife present, family | 760 |
| Female householder, no husband present, family | 1,107 |
| Nonfamily households | 1,399 |
| Average household size | 3.62 |
| Average family size | 4.02 |
Economic characteristics in SELMA, CA
| Total households | 6,756 |
| Less than $10,000 | 340 |
| $10,000 to $14,999 | 373 |
| $15,000 to $24,999 | 790 |
| $25,000 to $34,999 | 1,264 |
| $35,000 to $49,999 | 1,039 |
| $50,000 to $74,999 | 1,329 |
| $75,000 to $99,999 | 697 |
| $100,000 to $149,999 | 640 |
| $150,000 to $199,999 | 159 |
| $200,000 or more | 125 |
| Median household income (dollars) | 41,560 |
Housing characteristics in SELMA, CA
| Total housing units | 7,183 |
| Occupied housing units | 6,756 |
| Vacant housing units | 427 |
| Total housing units | 7,183 |
| 1-unit, detached | 5,567 |
| 1-unit, attached | 93 |
| 2 units | 95 |
| 3 or 4 units | 461 |
| 5 to 9 units | 294 |
| 10 to 19 units | 124 |
| 20 or more units | 126 |
| Mobile home | 413 |
| Boat, RV, van, etc. | 10 |
| Total housing units | 7,183 |
| Built 2014 or later | 16 |
| Built 2010 to 2013 | 193 |
| Built 2000 to 2009 | 1,345 |
| Built 1990 to 1999 | 1,330 |
| Built 1980 to 1989 | 928 |
| Built 1970 to 1979 | 964 |
| Built 1960 to 1969 | 349 |
| Built 1950 to 1959 | 1,043 |
| Built 1940 to 1949 | 567 |
| Built 1939 or earlier | 448 |
| Total housing units | 7,183 |
| 1 room | 27 |
| 2 rooms | 119 |
| 3 rooms | 330 |
| 4 rooms | 1,356 |
| 5 rooms | 2,423 |
| 6 rooms | 1,721 |
| 7 rooms | 795 |
| 8 rooms | 236 |
| 9 rooms or more | 176 |
| Median rooms | 5.2 |
| Total housing units | 7,183 |
| No bedroom | 27 |
| 1 bedroom | 463 |
| 2 bedrooms | 1,620 |
| 3 bedrooms | 3,588 |
| 4 bedrooms | 1,367 |
| 5 or more bedrooms | 118 |
| Occupied housing units | 6,756 |
| Owner-occupied | 3,980 |
| Renter-occupied | 2,776 |
| Average household size of owner-occupied unit | 3.49 |
| Average household size of renter-occupied unit | 3.81 |
| Occupied housing units | 6,756 |
| Moved in 2017 or later | 201 |
| Moved in 2015 to 2016 | 807 |
| Moved in 2010 to 2014 | 2,100 |
| Moved in 2000 to 2009 | 1,986 |
| Moved in 1990 to 1999 | 883 |
| Moved in 1989 and earlier | 779 |
| Owner-occupied units | 3,980 |
| Less than $50,000 | 253 |
| $50,000 to $99,999 | 333 |
| $100,000 to $149,999 | 533 |
| $150,000 to $199,999 | 1,290 |
| $200,000 to $299,999 | 1,267 |
| $300,000 to $499,999 | 270 |
| $500,000 to $999,999 | 18 |
| $1,000,000 or more | 16 |
| Median (dollars) | 174,500 |
| Owner-occupied units | 3,980 |
| Housing units with a mortgage | 2,990 |
| Housing units without a mortgage | 990 |
| Occupied units paying rent | 2,729 |
| Less than $500 | 204 |
| $500 to $999 | 1,270 |
| $1,000 to $1,499 | 950 |
| $1,500 to $1,999 | 305 |
| $2,000 to $2,499 | 0 |
| $2,500 to $2,999 | 0 |
| $3,000 or more | 0 |
| Median (dollars) | 940 |
| No rent paid | 47 |
Data is based on 2018 Census
ZIP Codes for other locations
State for SELMA
California ZIP CodesOther cities in California