WINDSOR, CA ZIP Code
| City | WINDSOR |
| State | California |
| ZIP Codes count | 1 (see all) |
| Post offices count | 1 (see all) |
| Total population | 27,506 (see all) |
ZIP Code in WINDSOR, California
95492
This list contains only 5-digit ZIP codes. Use our zip code lookup by address feature to get the full 9-digit (ZIP+4) code.
List of WINDSOR, CA ZIP Codes
| ZIP | TYPE | POPU |
|---|---|---|
| 95492 | STANDARD | 28,635 |
Post offices
WINDSOR — Post Office™ 8800 LAKEWOOD DR WINDSOR, CA 95492-7206 |
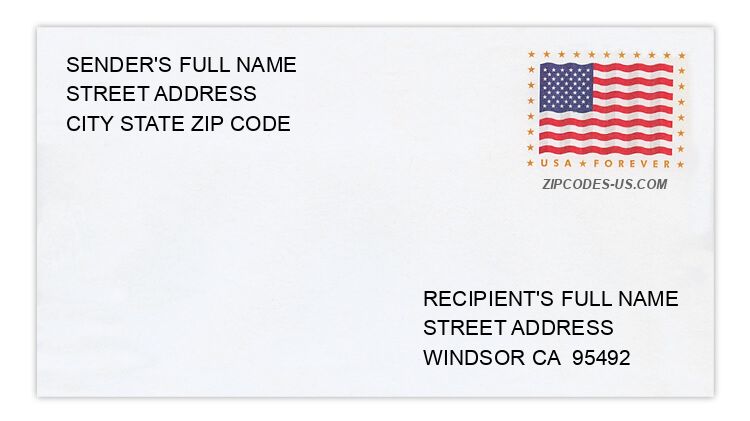
Envelope example
On the bottom center of the envelope, write the address you want your letter delivered to. Include the following on separate lines:
- Recipient's full name
- Full street address
- City, State, and ZIP Code
Using the same format, write the return address in the top left corner.
Using the full ZIP+4 Code when mailing via the USPS ensures the fastest, most accurate mailing possible. If you are not sure of the full 9-digit ZIP Code, use the 5-digit ZIP Code to avoid loss of letter or package.
The recipient address information is provided for your reference.
Address example
9191 LOS AMIGOS RD
WINDSOR CA 95492-9207
WINDSOR CA 95492-9207
485 PRINCESS WAY
WINDSOR CA 95492-8047
WINDSOR CA 95492-8047
745 SEQUOIA ST
WINDSOR CA 95492-9327
WINDSOR CA 95492-9327
9684 SOUTHAMPTON DR
WINDSOR CA 95492-8016
WINDSOR CA 95492-8016
174 TABATHA WAY
WINDSOR CA 95492-8551
WINDSOR CA 95492-8551
280 WADE DR
WINDSOR CA 95492-9266
WINDSOR CA 95492-9266
Map
Hover over the map to see the ZIP code
Census data for WINDSOR, CA
Demographic and housing estimates in WINDSOR, CA
| Total population | 27,506 |
| Male | 13,849 |
| Female | 13,657 |
| Total population | 27,506 |
| Under 5 years | 1,145 |
| 5 to 9 years | 1,911 |
| 10 to 14 years | 2,022 |
| 15 to 19 years | 2,421 |
| 20 to 24 years | 1,430 |
| 25 to 34 years | 2,953 |
| 35 to 44 years | 3,708 |
| 45 to 54 years | 4,107 |
| 55 to 59 years | 2,048 |
| 60 to 64 years | 1,669 |
| 65 to 74 years | 2,231 |
| 75 to 84 years | 1,316 |
| 85 years and over | 545 |
| Median age (years) | 40.5 |
| Under 18 years | 6,462 |
| 16 years and over | 21,994 |
| 18 years and over | 21,044 |
| 21 years and over | 19,743 |
| 62 years and over | 5,095 |
| 65 years and over | 4,092 |
| Total population | 27,506 |
| One race | 25,756 |
| White | 20,333 |
| Black or African American | 231 |
| American Indian and Alaska Native | 274 |
| Asian | 835 |
| Native Hawaiian and Other Pacific Islander | 0 |
| Some other race | 4,083 |
| Two or more races | 1,750 |
| Citizen, VOTING AGE 18 and over population | 19,115 |
| Male Citizen, VOTING AGE 18 and over population | 9,587 |
| Female Citizen, VOTING AGE 18 and over population | 9,528 |
Social characteristics in WINDSOR, CA
| Total households | 9,295 |
| Family households (families) | 7,210 |
| Married-couple family | 5,662 |
| Male householder, no wife present, family | 632 |
| Female householder, no husband present, family | 916 |
| Nonfamily households | 2,085 |
| Average household size | 2.95 |
| Average family size | 3.32 |
Economic characteristics in WINDSOR, CA
| Total households | 9,295 |
| Less than $10,000 | 217 |
| $10,000 to $14,999 | 142 |
| $15,000 to $24,999 | 424 |
| $25,000 to $34,999 | 477 |
| $35,000 to $49,999 | 718 |
| $50,000 to $74,999 | 1,348 |
| $75,000 to $99,999 | 1,326 |
| $100,000 to $149,999 | 2,201 |
| $150,000 to $199,999 | 1,322 |
| $200,000 or more | 1,120 |
| Median household income (dollars) | 99,792 |
Housing characteristics in WINDSOR, CA
| Total housing units | 9,593 |
| Occupied housing units | 9,295 |
| Vacant housing units | 298 |
| Total housing units | 9,593 |
| 1-unit, detached | 7,679 |
| 1-unit, attached | 543 |
| 2 units | 47 |
| 3 or 4 units | 220 |
| 5 to 9 units | 212 |
| 10 to 19 units | 85 |
| 20 or more units | 236 |
| Mobile home | 571 |
| Boat, RV, van, etc. | 0 |
| Total housing units | 9,593 |
| Built 2014 or later | 9 |
| Built 2010 to 2013 | 247 |
| Built 2000 to 2009 | 1,670 |
| Built 1990 to 1999 | 3,337 |
| Built 1980 to 1989 | 2,653 |
| Built 1970 to 1979 | 1,017 |
| Built 1960 to 1969 | 133 |
| Built 1950 to 1959 | 259 |
| Built 1940 to 1949 | 96 |
| Built 1939 or earlier | 172 |
| Total housing units | 9,593 |
| 1 room | 207 |
| 2 rooms | 186 |
| 3 rooms | 322 |
| 4 rooms | 1,126 |
| 5 rooms | 1,929 |
| 6 rooms | 2,168 |
| 7 rooms | 1,913 |
| 8 rooms | 919 |
| 9 rooms or more | 823 |
| Median rooms | 6.0 |
| Total housing units | 9,593 |
| No bedroom | 235 |
| 1 bedroom | 335 |
| 2 bedrooms | 1,525 |
| 3 bedrooms | 4,332 |
| 4 bedrooms | 2,779 |
| 5 or more bedrooms | 387 |
| Occupied housing units | 9,295 |
| Owner-occupied | 7,045 |
| Renter-occupied | 2,250 |
| Average household size of owner-occupied unit | 2.95 |
| Average household size of renter-occupied unit | 2.95 |
| Occupied housing units | 9,295 |
| Moved in 2017 or later | 266 |
| Moved in 2015 to 2016 | 797 |
| Moved in 2010 to 2014 | 2,555 |
| Moved in 2000 to 2009 | 3,014 |
| Moved in 1990 to 1999 | 1,915 |
| Moved in 1989 and earlier | 748 |
| Owner-occupied units | 7,045 |
| Less than $50,000 | 249 |
| $50,000 to $99,999 | 217 |
| $100,000 to $149,999 | 113 |
| $150,000 to $199,999 | 61 |
| $200,000 to $299,999 | 204 |
| $300,000 to $499,999 | 1,752 |
| $500,000 to $999,999 | 4,282 |
| $1,000,000 or more | 167 |
| Median (dollars) | 563,800 |
| Owner-occupied units | 7,045 |
| Housing units with a mortgage | 5,265 |
| Housing units without a mortgage | 1,780 |
| Occupied units paying rent | 2,088 |
| Less than $500 | 221 |
| $500 to $999 | 212 |
| $1,000 to $1,499 | 342 |
| $1,500 to $1,999 | 349 |
| $2,000 to $2,499 | 388 |
| $2,500 to $2,999 | 332 |
| $3,000 or more | 244 |
| Median (dollars) | 1,885 |
| No rent paid | 162 |
Data is based on 2018 Census
ZIP Codes for other locations
State for WINDSOR
California ZIP CodesOther cities in California