EVERGREEN, CO ZIP Code
| City | EVERGREEN |
| State | Colorado |
| ZIP Codes count | 3 (see all) |
| Post offices count | 3 (see all) |
| Total population | 8,602 (see all) |
ZIP Codes in EVERGREEN, Colorado
80401, 80437, 80439
This list contains only 5-digit ZIP codes. Use our zip code lookup by address feature to get the full 9-digit (ZIP+4) code.
List of EVERGREEN, CO ZIP Codes
| ZIP | TYPE | POPU |
|---|---|---|
| 80401 | STANDARD | 42,397 |
| 80437 | PO BOX | – |
| 80439 | STANDARD | 25,255 |
Post offices
DOWNTOWN GOLDEN — Post Office™ 619 12TH ST GOLDEN, CO 80401-9996 |
EVERGREEN — Post Office™ 3649 EVERGREEN PKWY EVERGREEN, CO 80439-9998 |
GOLDEN — Post Office™ 1100 JOHNSON RD GOLDEN, CO 80401-9998 |
Envelope example
On the bottom center of the envelope, write the address you want your letter delivered to. Include the following on separate lines:
- Recipient's full name
- Full street address
- City, State, and ZIP Code
Using the same format, write the return address in the top left corner.
Using the full ZIP+4 Code when mailing via the USPS ensures the fastest, most accurate mailing possible. If you are not sure of the full 9-digit ZIP Code, use the 5-digit ZIP Code to avoid loss of letter or package.
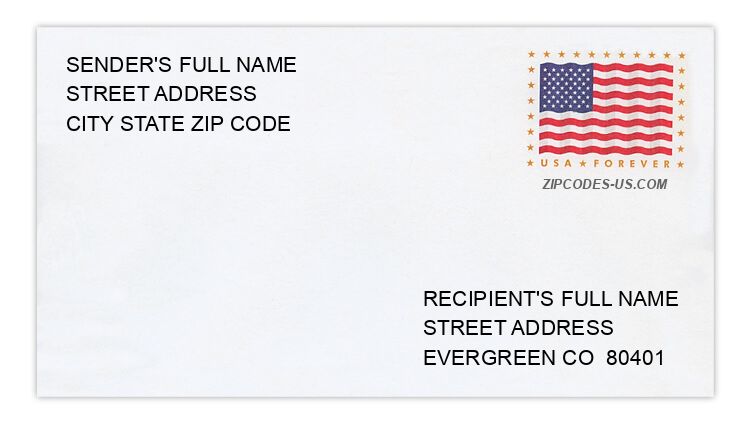
The recipient address information is provided for your reference.
Address example
3139 CHESTNUT LN
EVERGREEN CO 80439-8653
EVERGREEN CO 80439-8653
6703 JUNGFRAU DR
EVERGREEN CO 80439-5327
EVERGREEN CO 80439-5327
5726 NORTHWOOD DR
EVERGREEN CO 80439-5518
EVERGREEN CO 80439-5518
6430 PRAIRIE LN
EVERGREEN CO 80439-6554
EVERGREEN CO 80439-6554
30499 RUBY RANCH RD
EVERGREEN CO 80439-7833
EVERGREEN CO 80439-7833
5463 S TWIN SPRUCE DR
EVERGREEN CO 80439-5504
EVERGREEN CO 80439-5504
Map
Hover over the map to see the ZIP code
Census data for EVERGREEN, CO
Demographic and housing estimates in EVERGREEN, CO
| Total population | 8,602 |
| Male | 4,312 |
| Female | 4,290 |
| Total population | 8,602 |
| Under 5 years | 306 |
| 5 to 9 years | 500 |
| 10 to 14 years | 615 |
| 15 to 19 years | 511 |
| 20 to 24 years | 221 |
| 25 to 34 years | 689 |
| 35 to 44 years | 995 |
| 45 to 54 years | 1,691 |
| 55 to 59 years | 694 |
| 60 to 64 years | 731 |
| 65 to 74 years | 1,176 |
| 75 to 84 years | 379 |
| 85 years and over | 94 |
| Median age (years) | 47.1 |
| Under 18 years | 1,763 |
| 16 years and over | 7,059 |
| 18 years and over | 6,839 |
| 21 years and over | 6,631 |
| 62 years and over | 2,084 |
| 65 years and over | 1,649 |
| Total population | 8,602 |
| One race | 8,469 |
| White | 8,338 |
| Black or African American | 24 |
| American Indian and Alaska Native | 0 |
| Asian | 107 |
| Native Hawaiian and Other Pacific Islander | 0 |
| Some other race | 0 |
| Two or more races | 133 |
| Citizen, VOTING AGE 18 and over population | 6,755 |
| Male Citizen, VOTING AGE 18 and over population | 3,369 |
| Female Citizen, VOTING AGE 18 and over population | 3,386 |
Social characteristics in EVERGREEN, CO
| Total households | 3,663 |
| Family households (families) | 2,702 |
| Married-couple family | 2,265 |
| Male householder, no wife present, family | 153 |
| Female householder, no husband present, family | 284 |
| Nonfamily households | 961 |
| Average household size | 2.35 |
| Average family size | 2.72 |
Economic characteristics in EVERGREEN, CO
| Total households | 3,663 |
| Less than $10,000 | 98 |
| $10,000 to $14,999 | 58 |
| $15,000 to $24,999 | 173 |
| $25,000 to $34,999 | 246 |
| $35,000 to $49,999 | 246 |
| $50,000 to $74,999 | 480 |
| $75,000 to $99,999 | 319 |
| $100,000 to $149,999 | 981 |
| $150,000 to $199,999 | 452 |
| $200,000 or more | 610 |
| Median household income (dollars) | 107,437 |
Housing characteristics in EVERGREEN, CO
| Total housing units | 3,935 |
| Occupied housing units | 3,663 |
| Vacant housing units | 272 |
| Total housing units | 3,935 |
| 1-unit, detached | 3,503 |
| 1-unit, attached | 220 |
| 2 units | 37 |
| 3 or 4 units | 44 |
| 5 to 9 units | 88 |
| 10 to 19 units | 34 |
| 20 or more units | 0 |
| Mobile home | 9 |
| Boat, RV, van, etc. | 0 |
| Total housing units | 3,935 |
| Built 2014 or later | 0 |
| Built 2010 to 2013 | 34 |
| Built 2000 to 2009 | 224 |
| Built 1990 to 1999 | 599 |
| Built 1980 to 1989 | 542 |
| Built 1970 to 1979 | 1,307 |
| Built 1960 to 1969 | 532 |
| Built 1950 to 1959 | 235 |
| Built 1940 to 1949 | 55 |
| Built 1939 or earlier | 407 |
| Total housing units | 3,935 |
| 1 room | 17 |
| 2 rooms | 101 |
| 3 rooms | 255 |
| 4 rooms | 178 |
| 5 rooms | 554 |
| 6 rooms | 536 |
| 7 rooms | 736 |
| 8 rooms | 513 |
| 9 rooms or more | 1,045 |
| Median rooms | 6.9 |
| Total housing units | 3,935 |
| No bedroom | 49 |
| 1 bedroom | 325 |
| 2 bedrooms | 501 |
| 3 bedrooms | 1,416 |
| 4 bedrooms | 1,307 |
| 5 or more bedrooms | 337 |
| Occupied housing units | 3,663 |
| Owner-occupied | 3,040 |
| Renter-occupied | 623 |
| Average household size of owner-occupied unit | 2.36 |
| Average household size of renter-occupied unit | 2.31 |
| Occupied housing units | 3,663 |
| Moved in 2017 or later | 118 |
| Moved in 2015 to 2016 | 449 |
| Moved in 2010 to 2014 | 1,229 |
| Moved in 2000 to 2009 | 846 |
| Moved in 1990 to 1999 | 611 |
| Moved in 1989 and earlier | 410 |
| Owner-occupied units | 3,040 |
| Less than $50,000 | 0 |
| $50,000 to $99,999 | 9 |
| $100,000 to $149,999 | 0 |
| $150,000 to $199,999 | 91 |
| $200,000 to $299,999 | 404 |
| $300,000 to $499,999 | 1,319 |
| $500,000 to $999,999 | 1,085 |
| $1,000,000 or more | 132 |
| Median (dollars) | 456,300 |
| Owner-occupied units | 3,040 |
| Housing units with a mortgage | 2,283 |
| Housing units without a mortgage | 757 |
| Occupied units paying rent | 600 |
| Less than $500 | 0 |
| $500 to $999 | 146 |
| $1,000 to $1,499 | 129 |
| $1,500 to $1,999 | 81 |
| $2,000 to $2,499 | 193 |
| $2,500 to $2,999 | 0 |
| $3,000 or more | 51 |
| Median (dollars) | 1,654 |
| No rent paid | 23 |
Data is based on 2018 Census
ZIP Codes for other locations
State for EVERGREEN
Colorado ZIP CodesOther cities in Colorado