STERLING, CO ZIP Code
| City | STERLING |
| State | Colorado |
| ZIP Codes count | 1 (see all) |
| Post offices count | 1 (see all) |
| Total population | 13,775 (see all) |
ZIP Code in STERLING, Colorado
80751
This list contains only 5-digit ZIP codes. Use our zip code lookup by address feature to get the full 9-digit (ZIP+4) code.
List of STERLING, CO ZIP Codes
| ZIP | TYPE | POPU |
|---|---|---|
| 80751 | STANDARD | 17,718 |
Post offices
STERLING — Post Office™ 306 POPLAR ST STERLING, CO 80751-9998 |
Envelope example
On the bottom center of the envelope, write the address you want your letter delivered to. Include the following on separate lines:
- Recipient's full name
- Full street address
- City, State, and ZIP Code
Using the same format, write the return address in the top left corner.
Using the full ZIP+4 Code when mailing via the USPS ensures the fastest, most accurate mailing possible. If you are not sure of the full 9-digit ZIP Code, use the 5-digit ZIP Code to avoid loss of letter or package.
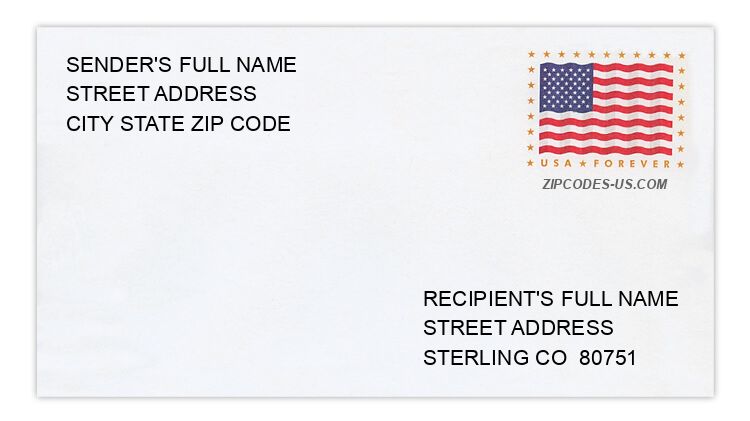
The recipient address information is provided for your reference.
Address example
575 CALIFORNIA ST
STERLING CO 80751-2213
STERLING CO 80751-2213
1425 COOLIDGE ST
STERLING CO 80751-2217
STERLING CO 80751-2217
2090 COUNTY ROAD 53
STERLING CO 80751-8912
STERLING CO 80751-8912
16535 COUNTY ROAD 67
STERLING CO 80751-8801
STERLING CO 80751-8801
15729 DEERFIELD ST
STERLING CO 80751-8766
STERLING CO 80751-8766
14249 SUMMIT DR
STERLING CO 80751-9034
STERLING CO 80751-9034
Map
Hover over the map to see the ZIP code
Census data for STERLING, CO
Demographic and housing estimates in STERLING, CO
| Total population | 13,775 |
| Male | 7,365 |
| Female | 6,410 |
| Total population | 13,775 |
| Under 5 years | 1,374 |
| 5 to 9 years | 609 |
| 10 to 14 years | 616 |
| 15 to 19 years | 1,101 |
| 20 to 24 years | 1,080 |
| 25 to 34 years | 2,047 |
| 35 to 44 years | 1,518 |
| 45 to 54 years | 1,782 |
| 55 to 59 years | 515 |
| 60 to 64 years | 876 |
| 65 to 74 years | 1,136 |
| 75 to 84 years | 533 |
| 85 years and over | 588 |
| Median age (years) | 35.2 |
| Under 18 years | 2,970 |
| 16 years and over | 11,012 |
| 18 years and over | 10,805 |
| 21 years and over | 9,776 |
| 62 years and over | 2,739 |
| 65 years and over | 2,257 |
| Total population | 13,775 |
| One race | 12,914 |
| White | 12,408 |
| Black or African American | 176 |
| American Indian and Alaska Native | 60 |
| Asian | 144 |
| Native Hawaiian and Other Pacific Islander | 0 |
| Some other race | 126 |
| Two or more races | 861 |
| Citizen, VOTING AGE 18 and over population | 10,339 |
| Male Citizen, VOTING AGE 18 and over population | 5,774 |
| Female Citizen, VOTING AGE 18 and over population | 4,565 |
Social characteristics in STERLING, CO
| Total households | 5,205 |
| Family households (families) | 2,670 |
| Married-couple family | 1,911 |
| Male householder, no wife present, family | 196 |
| Female householder, no husband present, family | 563 |
| Nonfamily households | 2,535 |
| Average household size | 2.47 |
| Average family size | 3.51 |
Economic characteristics in STERLING, CO
| Total households | 5,205 |
| Less than $10,000 | 511 |
| $10,000 to $14,999 | 485 |
| $15,000 to $24,999 | 573 |
| $25,000 to $34,999 | 646 |
| $35,000 to $49,999 | 817 |
| $50,000 to $74,999 | 954 |
| $75,000 to $99,999 | 710 |
| $100,000 to $149,999 | 352 |
| $150,000 to $199,999 | 75 |
| $200,000 or more | 82 |
| Median household income (dollars) | 41,220 |
Housing characteristics in STERLING, CO
| Total housing units | 5,668 |
| Occupied housing units | 5,205 |
| Vacant housing units | 463 |
| Total housing units | 5,668 |
| 1-unit, detached | 3,320 |
| 1-unit, attached | 323 |
| 2 units | 163 |
| 3 or 4 units | 394 |
| 5 to 9 units | 212 |
| 10 to 19 units | 206 |
| 20 or more units | 471 |
| Mobile home | 579 |
| Boat, RV, van, etc. | 0 |
| Total housing units | 5,668 |
| Built 2014 or later | 16 |
| Built 2010 to 2013 | 70 |
| Built 2000 to 2009 | 296 |
| Built 1990 to 1999 | 398 |
| Built 1980 to 1989 | 583 |
| Built 1970 to 1979 | 1,023 |
| Built 1960 to 1969 | 661 |
| Built 1950 to 1959 | 1,123 |
| Built 1940 to 1949 | 216 |
| Built 1939 or earlier | 1,282 |
| Total housing units | 5,668 |
| 1 room | 268 |
| 2 rooms | 66 |
| 3 rooms | 546 |
| 4 rooms | 1,226 |
| 5 rooms | 1,406 |
| 6 rooms | 725 |
| 7 rooms | 477 |
| 8 rooms | 351 |
| 9 rooms or more | 603 |
| Median rooms | 5.0 |
| Total housing units | 5,668 |
| No bedroom | 282 |
| 1 bedroom | 723 |
| 2 bedrooms | 1,847 |
| 3 bedrooms | 2,033 |
| 4 bedrooms | 584 |
| 5 or more bedrooms | 199 |
| Occupied housing units | 5,205 |
| Owner-occupied | 2,502 |
| Renter-occupied | 2,703 |
| Average household size of owner-occupied unit | 2.76 |
| Average household size of renter-occupied unit | 2.20 |
| Occupied housing units | 5,205 |
| Moved in 2017 or later | 465 |
| Moved in 2015 to 2016 | 846 |
| Moved in 2010 to 2014 | 1,853 |
| Moved in 2000 to 2009 | 852 |
| Moved in 1990 to 1999 | 602 |
| Moved in 1989 and earlier | 587 |
| Owner-occupied units | 2,502 |
| Less than $50,000 | 232 |
| $50,000 to $99,999 | 607 |
| $100,000 to $149,999 | 749 |
| $150,000 to $199,999 | 470 |
| $200,000 to $299,999 | 346 |
| $300,000 to $499,999 | 87 |
| $500,000 to $999,999 | 11 |
| $1,000,000 or more | 0 |
| Median (dollars) | 129,900 |
| Owner-occupied units | 2,502 |
| Housing units with a mortgage | 1,260 |
| Housing units without a mortgage | 1,242 |
| Occupied units paying rent | 2,691 |
| Less than $500 | 627 |
| $500 to $999 | 1,233 |
| $1,000 to $1,499 | 573 |
| $1,500 to $1,999 | 197 |
| $2,000 to $2,499 | 0 |
| $2,500 to $2,999 | 0 |
| $3,000 or more | 61 |
| Median (dollars) | 741 |
| No rent paid | 12 |
Data is based on 2018 Census
ZIP Codes for other locations
State for STERLING
Colorado ZIP CodesOther cities in Colorado