MIDDLETOWN, DE ZIP Code
| City | MIDDLETOWN |
| State | Delaware |
| ZIP Codes count | 1 (see all) |
| Post offices count | 1 (see all) |
| Total population | 21,250 (see all) |
ZIP Code in MIDDLETOWN, Delaware
19709
This list contains only 5-digit ZIP codes. Use our zip code lookup by address feature to get the full 9-digit (ZIP+4) code.
List of MIDDLETOWN, DE ZIP Codes
| ZIP | TYPE | POPU |
|---|---|---|
| 19709 | STANDARD | 46,773 |
Post offices
MIDDLETOWN — Post Office™ 298 E MAIN ST MIDDLETOWN, DE 19709-9998 |
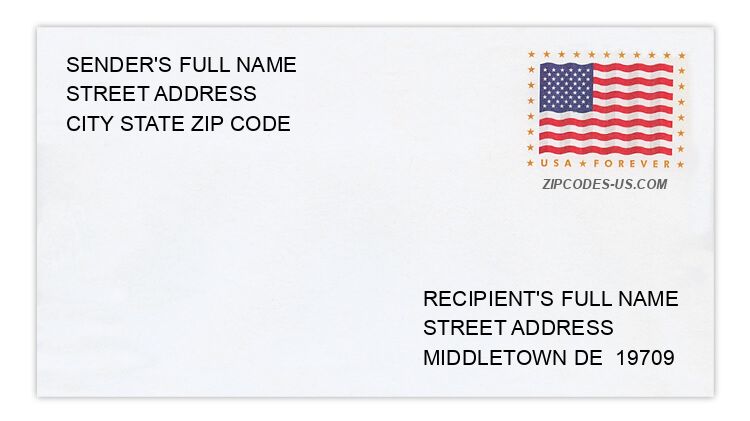
Envelope example
On the bottom center of the envelope, write the address you want your letter delivered to. Include the following on separate lines:
- Recipient's full name
- Full street address
- City, State, and ZIP Code
Using the same format, write the return address in the top left corner.
Using the full ZIP+4 Code when mailing via the USPS ensures the fastest, most accurate mailing possible. If you are not sure of the full 9-digit ZIP Code, use the 5-digit ZIP Code to avoid loss of letter or package.
The recipient address information is provided for your reference.
Address example
487 EMERSON RD
MIDDLETOWN DE 19709-9714
MIDDLETOWN DE 19709-9714
140 FAITH WAY
MIDDLETOWN DE 19709-1176
MIDDLETOWN DE 19709-1176
896 GEHRY DR
MIDDLETOWN DE 19709-9960
MIDDLETOWN DE 19709-9960
1096 LORD BYRON PL
MIDDLETOWN DE 19709-3265
MIDDLETOWN DE 19709-3265
306 N PARKWAY DR
MIDDLETOWN DE 19709-4639
MIDDLETOWN DE 19709-4639
217 PATIENCE WAY
MIDDLETOWN DE 19709-5814
MIDDLETOWN DE 19709-5814
Map
Hover over the map to see the ZIP code
Census data for MIDDLETOWN, DE
Demographic and housing estimates in MIDDLETOWN, DE
| Total population | 21,250 |
| Male | 9,989 |
| Female | 11,261 |
| Total population | 21,250 |
| Under 5 years | 1,303 |
| 5 to 9 years | 2,055 |
| 10 to 14 years | 1,659 |
| 15 to 19 years | 1,646 |
| 20 to 24 years | 1,038 |
| 25 to 34 years | 1,903 |
| 35 to 44 years | 3,068 |
| 45 to 54 years | 2,706 |
| 55 to 59 years | 1,068 |
| 60 to 64 years | 1,509 |
| 65 to 74 years | 1,744 |
| 75 to 84 years | 1,273 |
| 85 years and over | 278 |
| Median age (years) | 37.8 |
| Under 18 years | 6,280 |
| 16 years and over | 16,039 |
| 18 years and over | 14,970 |
| 21 years and over | 14,390 |
| 62 years and over | 4,107 |
| 65 years and over | 3,295 |
| Total population | 21,250 |
| One race | 20,620 |
| White | 13,842 |
| Black or African American | 5,784 |
| American Indian and Alaska Native | 0 |
| Asian | 567 |
| Native Hawaiian and Other Pacific Islander | 0 |
| Some other race | 427 |
| Two or more races | 630 |
| Citizen, VOTING AGE 18 and over population | 14,600 |
| Male Citizen, VOTING AGE 18 and over population | 7,004 |
| Female Citizen, VOTING AGE 18 and over population | 7,596 |
Social characteristics in MIDDLETOWN, DE
| Total households | 7,104 |
| Family households (families) | 5,336 |
| Married-couple family | 4,174 |
| Male householder, no wife present, family | 315 |
| Female householder, no husband present, family | 847 |
| Nonfamily households | 1,768 |
| Average household size | 2.97 |
| Average family size | 3.57 |
Economic characteristics in MIDDLETOWN, DE
| Total households | 7,104 |
| Less than $10,000 | 88 |
| $10,000 to $14,999 | 85 |
| $15,000 to $24,999 | 317 |
| $25,000 to $34,999 | 402 |
| $35,000 to $49,999 | 821 |
| $50,000 to $74,999 | 1,182 |
| $75,000 to $99,999 | 1,185 |
| $100,000 to $149,999 | 1,522 |
| $150,000 to $199,999 | 829 |
| $200,000 or more | 673 |
| Median household income (dollars) | 89,354 |
Housing characteristics in MIDDLETOWN, DE
| Total housing units | 7,723 |
| Occupied housing units | 7,104 |
| Vacant housing units | 619 |
| Total housing units | 7,723 |
| 1-unit, detached | 4,097 |
| 1-unit, attached | 2,476 |
| 2 units | 184 |
| 3 or 4 units | 79 |
| 5 to 9 units | 72 |
| 10 to 19 units | 370 |
| 20 or more units | 271 |
| Mobile home | 174 |
| Boat, RV, van, etc. | 0 |
| Total housing units | 7,723 |
| Built 2014 or later | 349 |
| Built 2010 to 2013 | 390 |
| Built 2000 to 2009 | 4,530 |
| Built 1990 to 1999 | 1,291 |
| Built 1980 to 1989 | 305 |
| Built 1970 to 1979 | 243 |
| Built 1960 to 1969 | 64 |
| Built 1950 to 1959 | 251 |
| Built 1940 to 1949 | 203 |
| Built 1939 or earlier | 97 |
| Total housing units | 7,723 |
| 1 room | 0 |
| 2 rooms | 0 |
| 3 rooms | 249 |
| 4 rooms | 934 |
| 5 rooms | 1,070 |
| 6 rooms | 1,154 |
| 7 rooms | 1,408 |
| 8 rooms | 938 |
| 9 rooms or more | 1,970 |
| Median rooms | 6.8 |
| Total housing units | 7,723 |
| No bedroom | 0 |
| 1 bedroom | 211 |
| 2 bedrooms | 1,819 |
| 3 bedrooms | 2,887 |
| 4 bedrooms | 2,333 |
| 5 or more bedrooms | 473 |
| Occupied housing units | 7,104 |
| Owner-occupied | 5,644 |
| Renter-occupied | 1,460 |
| Average household size of owner-occupied unit | 3.01 |
| Average household size of renter-occupied unit | 2.85 |
| Occupied housing units | 7,104 |
| Moved in 2017 or later | 563 |
| Moved in 2015 to 2016 | 1,021 |
| Moved in 2010 to 2014 | 1,460 |
| Moved in 2000 to 2009 | 3,537 |
| Moved in 1990 to 1999 | 403 |
| Moved in 1989 and earlier | 120 |
| Owner-occupied units | 5,644 |
| Less than $50,000 | 76 |
| $50,000 to $99,999 | 73 |
| $100,000 to $149,999 | 138 |
| $150,000 to $199,999 | 1,040 |
| $200,000 to $299,999 | 1,688 |
| $300,000 to $499,999 | 2,500 |
| $500,000 to $999,999 | 129 |
| $1,000,000 or more | 0 |
| Median (dollars) | 288,400 |
| Owner-occupied units | 5,644 |
| Housing units with a mortgage | 4,578 |
| Housing units without a mortgage | 1,066 |
| Occupied units paying rent | 1,443 |
| Less than $500 | 52 |
| $500 to $999 | 301 |
| $1,000 to $1,499 | 740 |
| $1,500 to $1,999 | 294 |
| $2,000 to $2,499 | 35 |
| $2,500 to $2,999 | 21 |
| $3,000 or more | 0 |
| Median (dollars) | 1,202 |
| No rent paid | 17 |
Data is based on 2018 Census
ZIP Codes for other locations
State for MIDDLETOWN
Delaware ZIP CodesOther cities in Delaware