DELRAY BEACH, FL ZIP Code
| City | DELRAY BEACH |
| State | Florida |
| ZIP Codes count | 7 (see all) |
| Post offices count | 2 (see all) |
| Total population | 67,353 (see all) |
ZIP Codes in DELRAY BEACH, Florida
The ZIP Codes in DELRAY BEACH, Florida fall within the range from 33444 to 33484. DELRAY BEACH is covered by 7 ZIP Codes: 5 Standard and 2 PO Box. Below is the complete list:
33444, 33445, 33446, 33448, 33482, 33483, 33484
This list contains only 5-digit ZIP codes. Use our zip code lookup by address feature to get the full 9-digit (ZIP+4) code.
List of DELRAY BEACH, FL ZIP Codes
| ZIP | TYPE | POPU |
|---|---|---|
| 33444 | STANDARD | 23,842 |
| 33445 | STANDARD | 30,309 |
| 33446 | STANDARD | 26,791 |
| 33448 | PO BOX | – |
| 33482 | PO BOX | – |
| 33483 | STANDARD | 12,795 |
| 33484 | STANDARD | 26,457 |
Post offices
DELRAY BEACH — Post Office™ 14280 S MILITARY TRL DELRAY BEACH, FL 33484-9998 |
WEST DELRAY BEACH — Post Office™ 10290 ATLANTIC AVE DELRAY BEACH, FL 33446-9998 |
Envelope example
On the bottom center of the envelope, write the address you want your letter delivered to. Include the following on separate lines:
- Recipient's full name
- Full street address
- City, State, and ZIP Code
Using the same format, write the return address in the top left corner.
Using the full ZIP+4 Code when mailing via the USPS ensures the fastest, most accurate mailing possible. If you are not sure of the full 9-digit ZIP Code, use the 5-digit ZIP Code to avoid loss of letter or package.
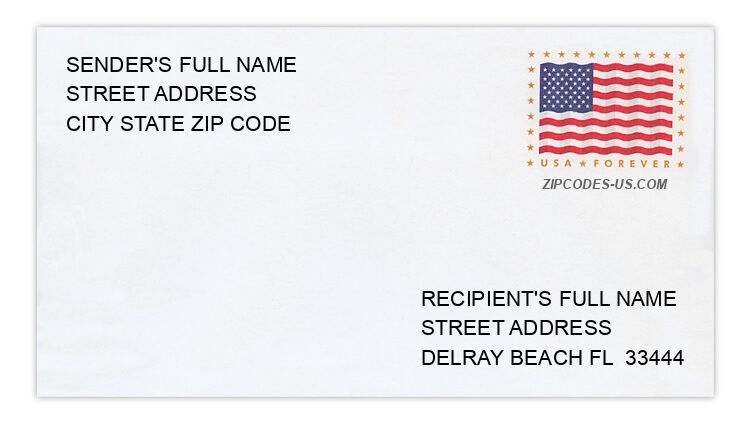
The recipient address information is provided for your reference.
Address example
14408 AMAPOLA WAY
DELRAY BEACH FL 33484-2522
DELRAY BEACH FL 33484-2522
606 EAGLE CIR
DELRAY BEACH FL 33444-1839
DELRAY BEACH FL 33444-1839
688 EAGLE CIR
DELRAY BEACH FL 33444-1839
DELRAY BEACH FL 33444-1839
520 BRITTANY K
DELRAY BEACH FL 33446-1164
DELRAY BEACH FL 33446-1164
14439 AMAPOLA WAY
DELRAY BEACH FL 33484-2521
DELRAY BEACH FL 33484-2521
528 NE 5TH AVE
DELRAY BEACH FL 33483-5635
DELRAY BEACH FL 33483-5635
Map
Hover over the map to see the ZIP code
Census data for DELRAY BEACH, FL
Demographic and housing estimates in DELRAY BEACH, FL
| Total population | 67,353 |
| Male | 32,895 |
| Female | 34,458 |
| Total population | 67,353 |
| Under 5 years | 2,974 |
| 5 to 9 years | 2,867 |
| 10 to 14 years | 2,568 |
| 15 to 19 years | 3,153 |
| 20 to 24 years | 4,308 |
| 25 to 34 years | 9,479 |
| 35 to 44 years | 7,514 |
| 45 to 54 years | 8,568 |
| 55 to 59 years | 4,827 |
| 60 to 64 years | 4,469 |
| 65 to 74 years | 7,939 |
| 75 to 84 years | 5,089 |
| 85 years and over | 3,598 |
| Median age (years) | 46.0 |
| Under 18 years | 10,430 |
| 16 years and over | 58,323 |
| 18 years and over | 56,923 |
| 21 years and over | 55,252 |
| 62 years and over | 19,313 |
| 65 years and over | 16,626 |
| Total population | 67,353 |
| One race | 65,866 |
| White | 40,975 |
| Black or African American | 21,019 |
| American Indian and Alaska Native | 58 |
| Asian | 1,656 |
| Native Hawaiian and Other Pacific Islander | 70 |
| Some other race | 2,088 |
| Two or more races | 1,487 |
| Citizen, VOTING AGE 18 and over population | 49,217 |
| Male Citizen, VOTING AGE 18 and over population | 23,489 |
| Female Citizen, VOTING AGE 18 and over population | 25,728 |
Social characteristics in DELRAY BEACH, FL
| Total households | 27,609 |
| Family households (families) | 14,522 |
| Married-couple family | 10,142 |
| Male householder, no wife present, family | 1,401 |
| Female householder, no husband present, family | 2,979 |
| Nonfamily households | 13,087 |
| Average household size | 2.40 |
| Average family size | 3.22 |
Economic characteristics in DELRAY BEACH, FL
| Total households | 27,609 |
| Less than $10,000 | 1,838 |
| $10,000 to $14,999 | 1,114 |
| $15,000 to $24,999 | 2,766 |
| $25,000 to $34,999 | 2,650 |
| $35,000 to $49,999 | 3,657 |
| $50,000 to $74,999 | 5,021 |
| $75,000 to $99,999 | 3,102 |
| $100,000 to $149,999 | 3,570 |
| $150,000 to $199,999 | 1,468 |
| $200,000 or more | 2,423 |
| Median household income (dollars) | 56,532 |
Housing characteristics in DELRAY BEACH, FL
| Total housing units | 34,575 |
| Occupied housing units | 27,609 |
| Vacant housing units | 6,966 |
| Total housing units | 34,575 |
| 1-unit, detached | 11,592 |
| 1-unit, attached | 4,273 |
| 2 units | 971 |
| 3 or 4 units | 4,701 |
| 5 to 9 units | 3,107 |
| 10 to 19 units | 2,949 |
| 20 or more units | 6,717 |
| Mobile home | 188 |
| Boat, RV, van, etc. | 77 |
| Total housing units | 34,575 |
| Built 2014 or later | 570 |
| Built 2010 to 2013 | 723 |
| Built 2000 to 2009 | 4,273 |
| Built 1990 to 1999 | 4,558 |
| Built 1980 to 1989 | 8,209 |
| Built 1970 to 1979 | 10,402 |
| Built 1960 to 1969 | 2,740 |
| Built 1950 to 1959 | 1,961 |
| Built 1940 to 1949 | 366 |
| Built 1939 or earlier | 773 |
| Total housing units | 34,575 |
| 1 room | 318 |
| 2 rooms | 679 |
| 3 rooms | 4,551 |
| 4 rooms | 11,891 |
| 5 rooms | 7,664 |
| 6 rooms | 4,497 |
| 7 rooms | 2,094 |
| 8 rooms | 1,529 |
| 9 rooms or more | 1,352 |
| Median rooms | 4.5 |
| Total housing units | 34,575 |
| No bedroom | 327 |
| 1 bedroom | 4,831 |
| 2 bedrooms | 16,474 |
| 3 bedrooms | 9,230 |
| 4 bedrooms | 3,134 |
| 5 or more bedrooms | 579 |
| Occupied housing units | 27,609 |
| Owner-occupied | 16,578 |
| Renter-occupied | 11,031 |
| Average household size of owner-occupied unit | 2.33 |
| Average household size of renter-occupied unit | 2.50 |
| Occupied housing units | 27,609 |
| Moved in 2017 or later | 1,845 |
| Moved in 2015 to 2016 | 3,587 |
| Moved in 2010 to 2014 | 8,726 |
| Moved in 2000 to 2009 | 7,482 |
| Moved in 1990 to 1999 | 3,775 |
| Moved in 1989 and earlier | 2,194 |
| Owner-occupied units | 16,578 |
| Less than $50,000 | 539 |
| $50,000 to $99,999 | 1,841 |
| $100,000 to $149,999 | 2,045 |
| $150,000 to $199,999 | 1,810 |
| $200,000 to $299,999 | 3,095 |
| $300,000 to $499,999 | 3,944 |
| $500,000 to $999,999 | 2,170 |
| $1,000,000 or more | 1,134 |
| Median (dollars) | 267,100 |
| Owner-occupied units | 16,578 |
| Housing units with a mortgage | 9,033 |
| Housing units without a mortgage | 7,545 |
| Occupied units paying rent | 10,595 |
| Less than $500 | 307 |
| $500 to $999 | 1,529 |
| $1,000 to $1,499 | 3,755 |
| $1,500 to $1,999 | 2,793 |
| $2,000 to $2,499 | 1,492 |
| $2,500 to $2,999 | 417 |
| $3,000 or more | 302 |
| Median (dollars) | 1,465 |
| No rent paid | 436 |
Data is based on 2018 Census
ZIP Codes for other locations
State for DELRAY BEACH
Florida ZIP CodesOther cities in Florida