BLACKFOOT, ID ZIP Code
| City | BLACKFOOT |
| State | Idaho |
| ZIP Codes count | 1 (see all) |
| Post offices count | 1 (see all) |
| Total population | 11,854 (see all) |
ZIP Code in BLACKFOOT, Idaho
83221
This list contains only 5-digit ZIP codes. Use our zip code lookup by address feature to get the full 9-digit (ZIP+4) code.
List of BLACKFOOT, ID ZIP Codes
| ZIP | TYPE | POPU |
|---|---|---|
| 83221 | STANDARD | 28,184 |
Post offices
BLACKFOOT — Post Office™ 165 W PACIFIC ST BLACKFOOT, ID 83221-9998 |
Envelope example
On the bottom center of the envelope, write the address you want your letter delivered to. Include the following on separate lines:
- Recipient's full name
- Full street address
- City, State, and ZIP Code
Using the same format, write the return address in the top left corner.
Using the full ZIP+4 Code when mailing via the USPS ensures the fastest, most accurate mailing possible. If you are not sure of the full 9-digit ZIP Code, use the 5-digit ZIP Code to avoid loss of letter or package.
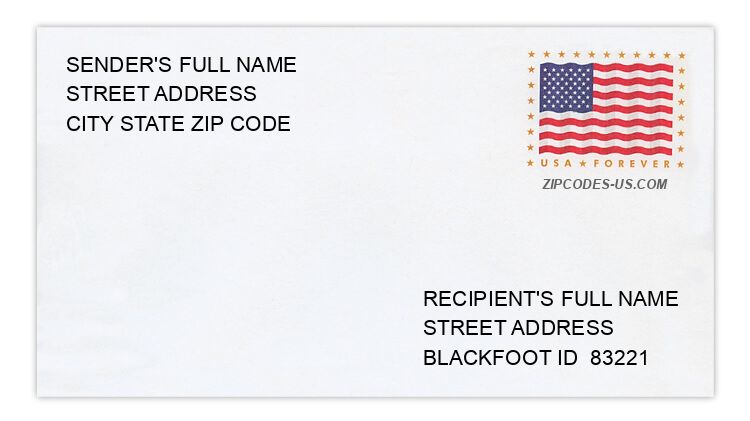
The recipient address information is provided for your reference.
Address example
678 BLACKHAWK RD
BLACKFOOT ID 83221-7036
BLACKFOOT ID 83221-7036
1556 CONESTOGA CIR
BLACKFOOT ID 83221-3023
BLACKFOOT ID 83221-3023
282 N 1000 W
BLACKFOOT ID 83221-5288
BLACKFOOT ID 83221-5288
991 NOYUSE RD
BLACKFOOT ID 83221-7046
BLACKFOOT ID 83221-7046
7 S 500 W
BLACKFOOT ID 83221-6159
BLACKFOOT ID 83221-6159
904 W 125 N
BLACKFOOT ID 83221-5499
BLACKFOOT ID 83221-5499
Map
Hover over the map to see the ZIP code
Census data for BLACKFOOT, ID
Demographic and housing estimates in BLACKFOOT, ID
| Total population | 11,854 |
| Male | 5,832 |
| Female | 6,022 |
| Total population | 11,854 |
| Under 5 years | 1,002 |
| 5 to 9 years | 1,239 |
| 10 to 14 years | 767 |
| 15 to 19 years | 886 |
| 20 to 24 years | 832 |
| 25 to 34 years | 1,911 |
| 35 to 44 years | 1,452 |
| 45 to 54 years | 1,093 |
| 55 to 59 years | 610 |
| 60 to 64 years | 495 |
| 65 to 74 years | 895 |
| 75 to 84 years | 481 |
| 85 years and over | 191 |
| Median age (years) | 30.9 |
| Under 18 years | 3,695 |
| 16 years and over | 8,614 |
| 18 years and over | 8,159 |
| 21 years and over | 7,878 |
| 62 years and over | 1,801 |
| 65 years and over | 1,567 |
| Total population | 11,854 |
| One race | 11,304 |
| White | 10,293 |
| Black or African American | 1 |
| American Indian and Alaska Native | 269 |
| Asian | 278 |
| Native Hawaiian and Other Pacific Islander | 0 |
| Some other race | 463 |
| Two or more races | 550 |
| Citizen, VOTING AGE 18 and over population | 7,898 |
| Male Citizen, VOTING AGE 18 and over population | 3,981 |
| Female Citizen, VOTING AGE 18 and over population | 3,917 |
Social characteristics in BLACKFOOT, ID
| Total households | 4,210 |
| Family households (families) | 2,643 |
| Married-couple family | 2,008 |
| Male householder, no wife present, family | 133 |
| Female householder, no husband present, family | 502 |
| Nonfamily households | 1,567 |
| Average household size | 2.76 |
| Average family size | 3.56 |
Economic characteristics in BLACKFOOT, ID
| Total households | 4,210 |
| Less than $10,000 | 378 |
| $10,000 to $14,999 | 270 |
| $15,000 to $24,999 | 573 |
| $25,000 to $34,999 | 560 |
| $35,000 to $49,999 | 602 |
| $50,000 to $74,999 | 753 |
| $75,000 to $99,999 | 501 |
| $100,000 to $149,999 | 446 |
| $150,000 to $199,999 | 31 |
| $200,000 or more | 96 |
| Median household income (dollars) | 42,606 |
Housing characteristics in BLACKFOOT, ID
| Total housing units | 4,785 |
| Occupied housing units | 4,210 |
| Vacant housing units | 575 |
| Total housing units | 4,785 |
| 1-unit, detached | 3,067 |
| 1-unit, attached | 127 |
| 2 units | 82 |
| 3 or 4 units | 655 |
| 5 to 9 units | 305 |
| 10 to 19 units | 16 |
| 20 or more units | 224 |
| Mobile home | 309 |
| Boat, RV, van, etc. | 0 |
| Total housing units | 4,785 |
| Built 2014 or later | 16 |
| Built 2010 to 2013 | 61 |
| Built 2000 to 2009 | 486 |
| Built 1990 to 1999 | 541 |
| Built 1980 to 1989 | 320 |
| Built 1970 to 1979 | 1,325 |
| Built 1960 to 1969 | 560 |
| Built 1950 to 1959 | 673 |
| Built 1940 to 1949 | 302 |
| Built 1939 or earlier | 501 |
| Total housing units | 4,785 |
| 1 room | 142 |
| 2 rooms | 86 |
| 3 rooms | 448 |
| 4 rooms | 983 |
| 5 rooms | 916 |
| 6 rooms | 727 |
| 7 rooms | 416 |
| 8 rooms | 493 |
| 9 rooms or more | 574 |
| Median rooms | 5.3 |
| Total housing units | 4,785 |
| No bedroom | 142 |
| 1 bedroom | 402 |
| 2 bedrooms | 1,315 |
| 3 bedrooms | 1,651 |
| 4 bedrooms | 853 |
| 5 or more bedrooms | 422 |
| Occupied housing units | 4,210 |
| Owner-occupied | 2,571 |
| Renter-occupied | 1,639 |
| Average household size of owner-occupied unit | 2.99 |
| Average household size of renter-occupied unit | 2.39 |
| Occupied housing units | 4,210 |
| Moved in 2017 or later | 284 |
| Moved in 2015 to 2016 | 487 |
| Moved in 2010 to 2014 | 1,266 |
| Moved in 2000 to 2009 | 1,046 |
| Moved in 1990 to 1999 | 533 |
| Moved in 1989 and earlier | 594 |
| Owner-occupied units | 2,571 |
| Less than $50,000 | 144 |
| $50,000 to $99,999 | 647 |
| $100,000 to $149,999 | 858 |
| $150,000 to $199,999 | 593 |
| $200,000 to $299,999 | 285 |
| $300,000 to $499,999 | 30 |
| $500,000 to $999,999 | 14 |
| $1,000,000 or more | 0 |
| Median (dollars) | 124,100 |
| Owner-occupied units | 2,571 |
| Housing units with a mortgage | 1,768 |
| Housing units without a mortgage | 803 |
| Occupied units paying rent | 1,574 |
| Less than $500 | 500 |
| $500 to $999 | 811 |
| $1,000 to $1,499 | 200 |
| $1,500 to $1,999 | 63 |
| $2,000 to $2,499 | 0 |
| $2,500 to $2,999 | 0 |
| $3,000 or more | 0 |
| Median (dollars) | 598 |
| No rent paid | 65 |
Data is based on 2018 Census
ZIP Codes for other locations
State for BLACKFOOT
Idaho ZIP CodesOther cities in Idaho