GARDEN CITY, ID ZIP Code
| City | GARDEN CITY |
| State | Idaho |
| ZIP Codes count | 2 (see all) |
| Post offices count | 3 (see all) |
| Total population | 11,743 (see all) |
ZIP Codes in GARDEN CITY, Idaho
83703, 83714
This list contains only 5-digit ZIP codes. Use our zip code lookup by address feature to get the full 9-digit (ZIP+4) code.
List of GARDEN CITY, ID ZIP Codes
| ZIP | TYPE | POPU |
|---|---|---|
| 83703 | STANDARD | 17,963 |
| 83714 | STANDARD | 25,050 |
Post offices
BOISE MAIN OFFICE — Post Office™ 770 S 13TH ST BOISE, ID 83708-9995 |
COLLISTER — Post Office™ 4650 W STATE ST BOISE, ID 83703-4102 |
GARDEN CITY — Post Office™ 8100 W MARIGOLD ST GARDEN CITY, ID 83714-9998 |
Envelope example
On the bottom center of the envelope, write the address you want your letter delivered to. Include the following on separate lines:
- Recipient's full name
- Full street address
- City, State, and ZIP Code
Using the same format, write the return address in the top left corner.
Using the full ZIP+4 Code when mailing via the USPS ensures the fastest, most accurate mailing possible. If you are not sure of the full 9-digit ZIP Code, use the 5-digit ZIP Code to avoid loss of letter or package.
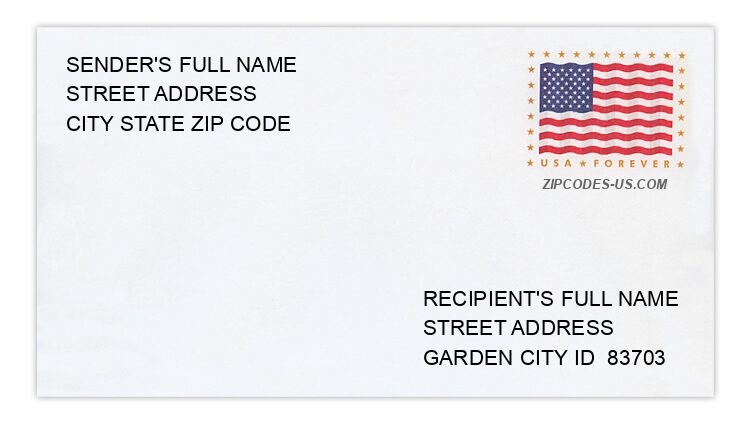
The recipient address information is provided for your reference.
Address example
335 E 37TH ST
GARDEN CITY ID 83714-6419
GARDEN CITY ID 83714-6419
4896 LAKE SHORE PL
GARDEN CITY ID 83714-1744
GARDEN CITY ID 83714-1744
5935 N CLOUD NINE DR
GARDEN CITY ID 83714-1711
GARDEN CITY ID 83714-1711
5337 N LAKEMONT LN
GARDEN CITY ID 83714-1773
GARDEN CITY ID 83714-1773
8160 W CHINDEN BLVD
GARDEN CITY ID 83714-1367
GARDEN CITY ID 83714-1367
8535 WILLOWDALE DR
GARDEN CITY ID 83714-1727
GARDEN CITY ID 83714-1727
Map
Hover over the map to see the ZIP code
Census data for GARDEN CITY, ID
Demographic and housing estimates in GARDEN CITY, ID
| Total population | 11,743 |
| Male | 5,581 |
| Female | 6,162 |
| Total population | 11,743 |
| Under 5 years | 664 |
| 5 to 9 years | 621 |
| 10 to 14 years | 527 |
| 15 to 19 years | 443 |
| 20 to 24 years | 595 |
| 25 to 34 years | 1,569 |
| 35 to 44 years | 998 |
| 45 to 54 years | 1,371 |
| 55 to 59 years | 1,080 |
| 60 to 64 years | 1,059 |
| 65 to 74 years | 1,565 |
| 75 to 84 years | 921 |
| 85 years and over | 330 |
| Median age (years) | 47.6 |
| Under 18 years | 2,097 |
| 16 years and over | 9,883 |
| 18 years and over | 9,646 |
| 21 years and over | 9,407 |
| 62 years and over | 3,470 |
| 65 years and over | 2,816 |
| Total population | 11,743 |
| One race | 11,530 |
| White | 10,940 |
| Black or African American | 172 |
| American Indian and Alaska Native | 14 |
| Asian | 51 |
| Native Hawaiian and Other Pacific Islander | 0 |
| Some other race | 353 |
| Two or more races | 213 |
| Citizen, VOTING AGE 18 and over population | 9,329 |
| Male Citizen, VOTING AGE 18 and over population | 4,527 |
| Female Citizen, VOTING AGE 18 and over population | 4,802 |
Social characteristics in GARDEN CITY, ID
| Total households | 5,624 |
| Family households (families) | 2,951 |
| Married-couple family | 2,226 |
| Male householder, no wife present, family | 191 |
| Female householder, no husband present, family | 534 |
| Nonfamily households | 2,673 |
| Average household size | 2.08 |
| Average family size | 2.75 |
Economic characteristics in GARDEN CITY, ID
| Total households | 5,624 |
| Less than $10,000 | 462 |
| $10,000 to $14,999 | 262 |
| $15,000 to $24,999 | 902 |
| $25,000 to $34,999 | 640 |
| $35,000 to $49,999 | 664 |
| $50,000 to $74,999 | 980 |
| $75,000 to $99,999 | 695 |
| $100,000 to $149,999 | 624 |
| $150,000 to $199,999 | 151 |
| $200,000 or more | 244 |
| Median household income (dollars) | 46,311 |
Housing characteristics in GARDEN CITY, ID
| Total housing units | 6,018 |
| Occupied housing units | 5,624 |
| Vacant housing units | 394 |
| Total housing units | 6,018 |
| 1-unit, detached | 3,197 |
| 1-unit, attached | 550 |
| 2 units | 101 |
| 3 or 4 units | 227 |
| 5 to 9 units | 304 |
| 10 to 19 units | 173 |
| 20 or more units | 371 |
| Mobile home | 1,095 |
| Boat, RV, van, etc. | 0 |
| Total housing units | 6,018 |
| Built 2014 or later | 93 |
| Built 2010 to 2013 | 153 |
| Built 2000 to 2009 | 1,220 |
| Built 1990 to 1999 | 1,784 |
| Built 1980 to 1989 | 909 |
| Built 1970 to 1979 | 1,263 |
| Built 1960 to 1969 | 323 |
| Built 1950 to 1959 | 112 |
| Built 1940 to 1949 | 106 |
| Built 1939 or earlier | 55 |
| Total housing units | 6,018 |
| 1 room | 154 |
| 2 rooms | 205 |
| 3 rooms | 645 |
| 4 rooms | 1,201 |
| 5 rooms | 1,337 |
| 6 rooms | 960 |
| 7 rooms | 546 |
| 8 rooms | 448 |
| 9 rooms or more | 522 |
| Median rooms | 5.1 |
| Total housing units | 6,018 |
| No bedroom | 166 |
| 1 bedroom | 530 |
| 2 bedrooms | 1,953 |
| 3 bedrooms | 2,601 |
| 4 bedrooms | 621 |
| 5 or more bedrooms | 147 |
| Occupied housing units | 5,624 |
| Owner-occupied | 3,291 |
| Renter-occupied | 2,333 |
| Average household size of owner-occupied unit | 2.08 |
| Average household size of renter-occupied unit | 2.08 |
| Occupied housing units | 5,624 |
| Moved in 2017 or later | 244 |
| Moved in 2015 to 2016 | 932 |
| Moved in 2010 to 2014 | 2,034 |
| Moved in 2000 to 2009 | 1,505 |
| Moved in 1990 to 1999 | 580 |
| Moved in 1989 and earlier | 329 |
| Owner-occupied units | 3,291 |
| Less than $50,000 | 312 |
| $50,000 to $99,999 | 159 |
| $100,000 to $149,999 | 350 |
| $150,000 to $199,999 | 734 |
| $200,000 to $299,999 | 673 |
| $300,000 to $499,999 | 766 |
| $500,000 to $999,999 | 287 |
| $1,000,000 or more | 10 |
| Median (dollars) | 213,200 |
| Owner-occupied units | 3,291 |
| Housing units with a mortgage | 1,864 |
| Housing units without a mortgage | 1,427 |
| Occupied units paying rent | 2,180 |
| Less than $500 | 202 |
| $500 to $999 | 1,362 |
| $1,000 to $1,499 | 573 |
| $1,500 to $1,999 | 31 |
| $2,000 to $2,499 | 12 |
| $2,500 to $2,999 | 0 |
| $3,000 or more | 0 |
| Median (dollars) | 808 |
| No rent paid | 153 |
Data is based on 2018 Census
ZIP Codes for other locations
State for GARDEN CITY
Idaho ZIP CodesOther cities in Idaho