OROFINO, ID ZIP Code
| City | OROFINO |
| State | Idaho |
| ZIP Codes count | 1 (see all) |
| Post offices count | 1 (see all) |
| Total population | 3,111 (see all) |
ZIP Code in OROFINO, Idaho
83544
This list contains only 5-digit ZIP codes. Use our zip code lookup by address feature to get the full 9-digit (ZIP+4) code.
List of OROFINO, ID ZIP Codes
| ZIP | TYPE | POPU |
|---|---|---|
| 83544 | STANDARD | 6,395 |
Post offices
OROFINO — Post Office™ 320 MICHIGAN AVE OROFINO, ID 83544-9998 |
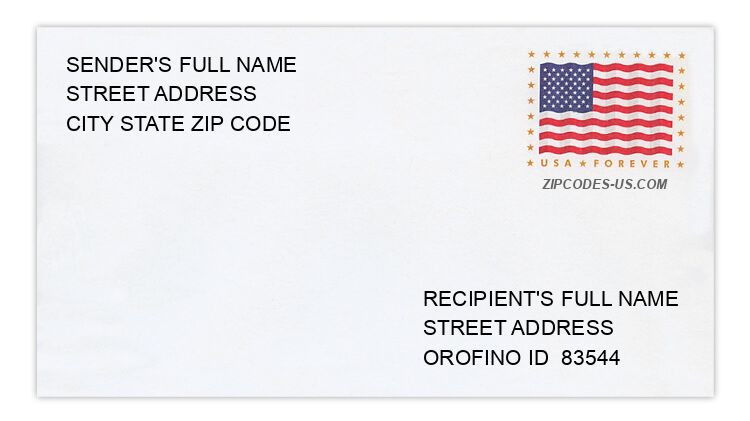
Envelope example
On the bottom center of the envelope, write the address you want your letter delivered to. Include the following on separate lines:
- Recipient's full name
- Full street address
- City, State, and ZIP Code
Using the same format, write the return address in the top left corner.
Using the full ZIP+4 Code when mailing via the USPS ensures the fastest, most accurate mailing possible. If you are not sure of the full 9-digit ZIP Code, use the 5-digit ZIP Code to avoid loss of letter or package.
The recipient address information is provided for your reference.
Address example
283 110TH ST
OROFINO ID 83544-9379
OROFINO ID 83544-9379
48 CANOE CAMP LOOP
OROFINO ID 83544-6455
OROFINO ID 83544-6455
1702 CAVENDISH HWY
OROFINO ID 83544-6476
OROFINO ID 83544-6476
239 DEER CEDAR RD
OROFINO ID 83544-6306
OROFINO ID 83544-6306
126 MULE DEER DR
OROFINO ID 83544-9360
OROFINO ID 83544-9360
73 ROLLING HILLS DR
OROFINO ID 83544-6194
OROFINO ID 83544-6194
Map
Hover over the map to see the ZIP code
Census data for OROFINO, ID
Demographic and housing estimates in OROFINO, ID
| Total population | 3,111 |
| Male | 1,951 |
| Female | 1,160 |
| Total population | 3,111 |
| Under 5 years | 129 |
| 5 to 9 years | 182 |
| 10 to 14 years | 107 |
| 15 to 19 years | 109 |
| 20 to 24 years | 195 |
| 25 to 34 years | 564 |
| 35 to 44 years | 500 |
| 45 to 54 years | 403 |
| 55 to 59 years | 168 |
| 60 to 64 years | 205 |
| 65 to 74 years | 266 |
| 75 to 84 years | 202 |
| 85 years and over | 81 |
| Median age (years) | 40.5 |
| Under 18 years | 477 |
| 16 years and over | 2,678 |
| 18 years and over | 2,634 |
| 21 years and over | 2,559 |
| 62 years and over | 672 |
| 65 years and over | 549 |
| Total population | 3,111 |
| One race | 3,044 |
| White | 2,830 |
| Black or African American | 16 |
| American Indian and Alaska Native | 75 |
| Asian | 15 |
| Native Hawaiian and Other Pacific Islander | 13 |
| Some other race | 95 |
| Two or more races | 67 |
| Citizen, VOTING AGE 18 and over population | 2,606 |
| Male Citizen, VOTING AGE 18 and over population | 1,682 |
| Female Citizen, VOTING AGE 18 and over population | 924 |
Social characteristics in OROFINO, ID
| Total households | 1,015 |
| Family households (families) | 595 |
| Married-couple family | 461 |
| Male householder, no wife present, family | 52 |
| Female householder, no husband present, family | 82 |
| Nonfamily households | 420 |
| Average household size | 2.13 |
| Average family size | 2.70 |
Economic characteristics in OROFINO, ID
| Total households | 1,015 |
| Less than $10,000 | 37 |
| $10,000 to $14,999 | 59 |
| $15,000 to $24,999 | 123 |
| $25,000 to $34,999 | 165 |
| $35,000 to $49,999 | 192 |
| $50,000 to $74,999 | 228 |
| $75,000 to $99,999 | 114 |
| $100,000 to $149,999 | 69 |
| $150,000 to $199,999 | 8 |
| $200,000 or more | 20 |
| Median household income (dollars) | 44,375 |
Housing characteristics in OROFINO, ID
| Total housing units | 1,155 |
| Occupied housing units | 1,015 |
| Vacant housing units | 140 |
| Total housing units | 1,155 |
| 1-unit, detached | 850 |
| 1-unit, attached | 9 |
| 2 units | 24 |
| 3 or 4 units | 26 |
| 5 to 9 units | 13 |
| 10 to 19 units | 40 |
| 20 or more units | 71 |
| Mobile home | 118 |
| Boat, RV, van, etc. | 4 |
| Total housing units | 1,155 |
| Built 2014 or later | 0 |
| Built 2010 to 2013 | 0 |
| Built 2000 to 2009 | 58 |
| Built 1990 to 1999 | 97 |
| Built 1980 to 1989 | 143 |
| Built 1970 to 1979 | 255 |
| Built 1960 to 1969 | 156 |
| Built 1950 to 1959 | 138 |
| Built 1940 to 1949 | 62 |
| Built 1939 or earlier | 246 |
| Total housing units | 1,155 |
| 1 room | 48 |
| 2 rooms | 31 |
| 3 rooms | 126 |
| 4 rooms | 180 |
| 5 rooms | 241 |
| 6 rooms | 181 |
| 7 rooms | 134 |
| 8 rooms | 109 |
| 9 rooms or more | 105 |
| Median rooms | 5.3 |
| Total housing units | 1,155 |
| No bedroom | 48 |
| 1 bedroom | 131 |
| 2 bedrooms | 431 |
| 3 bedrooms | 323 |
| 4 bedrooms | 197 |
| 5 or more bedrooms | 25 |
| Occupied housing units | 1,015 |
| Owner-occupied | 591 |
| Renter-occupied | 424 |
| Average household size of owner-occupied unit | 2.08 |
| Average household size of renter-occupied unit | 2.19 |
| Occupied housing units | 1,015 |
| Moved in 2017 or later | 50 |
| Moved in 2015 to 2016 | 136 |
| Moved in 2010 to 2014 | 293 |
| Moved in 2000 to 2009 | 239 |
| Moved in 1990 to 1999 | 147 |
| Moved in 1989 and earlier | 150 |
| Owner-occupied units | 591 |
| Less than $50,000 | 46 |
| $50,000 to $99,999 | 146 |
| $100,000 to $149,999 | 197 |
| $150,000 to $199,999 | 91 |
| $200,000 to $299,999 | 98 |
| $300,000 to $499,999 | 8 |
| $500,000 to $999,999 | 5 |
| $1,000,000 or more | 0 |
| Median (dollars) | 123,700 |
| Owner-occupied units | 591 |
| Housing units with a mortgage | 335 |
| Housing units without a mortgage | 256 |
| Occupied units paying rent | 384 |
| Less than $500 | 65 |
| $500 to $999 | 250 |
| $1,000 to $1,499 | 40 |
| $1,500 to $1,999 | 14 |
| $2,000 to $2,499 | 10 |
| $2,500 to $2,999 | 5 |
| $3,000 or more | 0 |
| Median (dollars) | 744 |
| No rent paid | 40 |
Data is based on 2018 Census
ZIP Codes for other locations
State for OROFINO
Idaho ZIP CodesOther cities in Idaho