TWIN FALLS, ID ZIP Code
| City | TWIN FALLS |
| State | Idaho |
| ZIP Codes count | 3 (see all) |
| Post offices count | 2 (see all) |
| Total population | 48,225 (see all) |
ZIP Codes in TWIN FALLS, Idaho
83301, 83302, 83303
This list contains only 5-digit ZIP codes. Use our zip code lookup by address feature to get the full 9-digit (ZIP+4) code.
List of TWIN FALLS, ID ZIP Codes
| ZIP | TYPE | POPU |
|---|---|---|
| 83301 | STANDARD | 60,434 |
| 83302 | STANDARD | 268 |
| 83303 | PO BOX | – |
Post offices
PIONEER STATION — Post Office™ 1376 FILLMORE ST TWIN FALLS, ID 83301-9996 |
TWIN FALLS — Post Office™ 253 2ND AVE W TWIN FALLS, ID 83301-9998 |
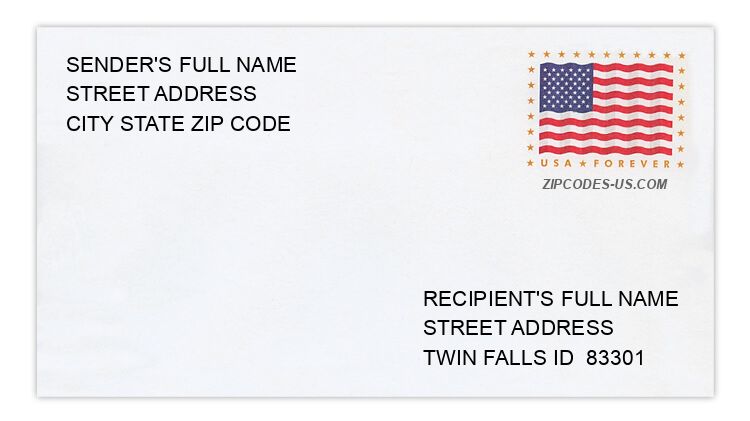
Envelope example
On the bottom center of the envelope, write the address you want your letter delivered to. Include the following on separate lines:
- Recipient's full name
- Full street address
- City, State, and ZIP Code
Using the same format, write the return address in the top left corner.
Using the full ZIP+4 Code when mailing via the USPS ensures the fastest, most accurate mailing possible. If you are not sure of the full 9-digit ZIP Code, use the 5-digit ZIP Code to avoid loss of letter or package.
The recipient address information is provided for your reference.
Address example
968 AMERICANA CIR
TWIN FALLS ID 83301-4096
TWIN FALLS ID 83301-4096
254 ASPENWOOD DR
TWIN FALLS ID 83301-8259
TWIN FALLS ID 83301-8259
1928 HAMPTON WAY
TWIN FALLS ID 83301-3008
TWIN FALLS ID 83301-3008
820 N POINTE DR
TWIN FALLS ID 83301-3286
TWIN FALLS ID 83301-3286
1045 PINEWOOD CIR
TWIN FALLS ID 83301-3338
TWIN FALLS ID 83301-3338
859 SUN PEAK WAY
TWIN FALLS ID 83301-8977
TWIN FALLS ID 83301-8977
Map
Hover over the map to see the ZIP code
Census data for TWIN FALLS, ID
Demographic and housing estimates in TWIN FALLS, ID
| Total population | 48,225 |
| Male | 23,292 |
| Female | 24,933 |
| Total population | 48,225 |
| Under 5 years | 3,791 |
| 5 to 9 years | 3,809 |
| 10 to 14 years | 3,979 |
| 15 to 19 years | 3,035 |
| 20 to 24 years | 3,142 |
| 25 to 34 years | 7,806 |
| 35 to 44 years | 5,962 |
| 45 to 54 years | 5,410 |
| 55 to 59 years | 2,477 |
| 60 to 64 years | 2,296 |
| 65 to 74 years | 3,631 |
| 75 to 84 years | 2,048 |
| 85 years and over | 839 |
| Median age (years) | 32.8 |
| Under 18 years | 13,440 |
| 16 years and over | 36,071 |
| 18 years and over | 34,785 |
| 21 years and over | 32,991 |
| 62 years and over | 7,881 |
| 65 years and over | 6,518 |
| Total population | 48,225 |
| One race | 47,387 |
| White | 43,814 |
| Black or African American | 542 |
| American Indian and Alaska Native | 482 |
| Asian | 1,347 |
| Native Hawaiian and Other Pacific Islander | 34 |
| Some other race | 1,168 |
| Two or more races | 838 |
| Citizen, VOTING AGE 18 and over population | 32,131 |
| Male Citizen, VOTING AGE 18 and over population | 15,672 |
| Female Citizen, VOTING AGE 18 and over population | 16,459 |
Social characteristics in TWIN FALLS, ID
| Total households | 18,047 |
| Family households (families) | 12,013 |
| Married-couple family | 8,829 |
| Male householder, no wife present, family | 931 |
| Female householder, no husband present, family | 2,253 |
| Nonfamily households | 6,034 |
| Average household size | 2.61 |
| Average family size | 3.19 |
Economic characteristics in TWIN FALLS, ID
| Total households | 18,047 |
| Less than $10,000 | 1,137 |
| $10,000 to $14,999 | 1,139 |
| $15,000 to $24,999 | 1,886 |
| $25,000 to $34,999 | 2,158 |
| $35,000 to $49,999 | 2,905 |
| $50,000 to $74,999 | 3,915 |
| $75,000 to $99,999 | 2,146 |
| $100,000 to $149,999 | 1,759 |
| $150,000 to $199,999 | 716 |
| $200,000 or more | 286 |
| Median household income (dollars) | 48,876 |
Housing characteristics in TWIN FALLS, ID
| Total housing units | 19,026 |
| Occupied housing units | 18,047 |
| Vacant housing units | 979 |
| Total housing units | 19,026 |
| 1-unit, detached | 13,664 |
| 1-unit, attached | 797 |
| 2 units | 426 |
| 3 or 4 units | 1,470 |
| 5 to 9 units | 855 |
| 10 to 19 units | 405 |
| 20 or more units | 653 |
| Mobile home | 741 |
| Boat, RV, van, etc. | 15 |
| Total housing units | 19,026 |
| Built 2014 or later | 608 |
| Built 2010 to 2013 | 689 |
| Built 2000 to 2009 | 3,941 |
| Built 1990 to 1999 | 2,473 |
| Built 1980 to 1989 | 1,975 |
| Built 1970 to 1979 | 2,842 |
| Built 1960 to 1969 | 1,137 |
| Built 1950 to 1959 | 2,198 |
| Built 1940 to 1949 | 926 |
| Built 1939 or earlier | 2,237 |
| Total housing units | 19,026 |
| 1 room | 391 |
| 2 rooms | 476 |
| 3 rooms | 1,111 |
| 4 rooms | 3,432 |
| 5 rooms | 3,931 |
| 6 rooms | 3,247 |
| 7 rooms | 2,339 |
| 8 rooms | 1,699 |
| 9 rooms or more | 2,400 |
| Median rooms | 5.6 |
| Total housing units | 19,026 |
| No bedroom | 467 |
| 1 bedroom | 1,547 |
| 2 bedrooms | 4,769 |
| 3 bedrooms | 8,002 |
| 4 bedrooms | 3,131 |
| 5 or more bedrooms | 1,110 |
| Occupied housing units | 18,047 |
| Owner-occupied | 11,346 |
| Renter-occupied | 6,701 |
| Average household size of owner-occupied unit | 2.77 |
| Average household size of renter-occupied unit | 2.35 |
| Occupied housing units | 18,047 |
| Moved in 2017 or later | 1,400 |
| Moved in 2015 to 2016 | 3,371 |
| Moved in 2010 to 2014 | 5,762 |
| Moved in 2000 to 2009 | 4,654 |
| Moved in 1990 to 1999 | 1,778 |
| Moved in 1989 and earlier | 1,082 |
| Owner-occupied units | 11,346 |
| Less than $50,000 | 721 |
| $50,000 to $99,999 | 1,557 |
| $100,000 to $149,999 | 3,082 |
| $150,000 to $199,999 | 2,950 |
| $200,000 to $299,999 | 2,261 |
| $300,000 to $499,999 | 705 |
| $500,000 to $999,999 | 70 |
| $1,000,000 or more | 0 |
| Median (dollars) | 154,000 |
| Owner-occupied units | 11,346 |
| Housing units with a mortgage | 7,496 |
| Housing units without a mortgage | 3,850 |
| Occupied units paying rent | 6,486 |
| Less than $500 | 1,087 |
| $500 to $999 | 3,628 |
| $1,000 to $1,499 | 1,400 |
| $1,500 to $1,999 | 175 |
| $2,000 to $2,499 | 90 |
| $2,500 to $2,999 | 0 |
| $3,000 or more | 106 |
| Median (dollars) | 793 |
| No rent paid | 215 |
Data is based on 2018 Census
ZIP Codes for other locations
State for TWIN FALLS
Idaho ZIP CodesOther cities in Idaho