DANVILLE, IN ZIP Code
| City | DANVILLE |
| State | Indiana |
| ZIP Codes count | 1 (see all) |
| Post offices count | 1 (see all) |
| Total population | 9,791 (see all) |
ZIP Code in DANVILLE, Indiana
46122
This list contains only 5-digit ZIP codes. Use our zip code lookup by address feature to get the full 9-digit (ZIP+4) code.
List of DANVILLE, IN ZIP Codes
| ZIP | TYPE | POPU |
|---|---|---|
| 46122 | STANDARD | 15,945 |
Post offices
DANVILLE — Post Office™ 1965 E MAIN ST DANVILLE, IN 46122-9998 |
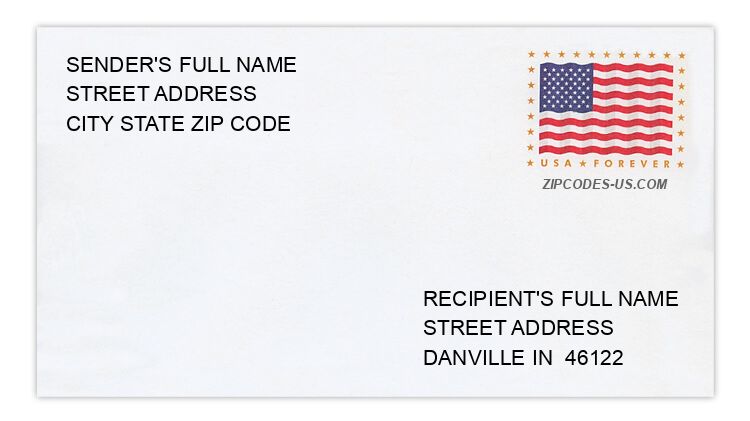
Envelope example
On the bottom center of the envelope, write the address you want your letter delivered to. Include the following on separate lines:
- Recipient's full name
- Full street address
- City, State, and ZIP Code
Using the same format, write the return address in the top left corner.
Using the full ZIP+4 Code when mailing via the USPS ensures the fastest, most accurate mailing possible. If you are not sure of the full 9-digit ZIP Code, use the 5-digit ZIP Code to avoid loss of letter or package.
The recipient address information is provided for your reference.
Address example
1956 DERBY CT
DANVILLE IN 46122-7827
DANVILLE IN 46122-7827
207 E CLINTON ST
DANVILLE IN 46122-1301
DANVILLE IN 46122-1301
2029 EDGEWOOD DR
DANVILLE IN 46122-7982
DANVILLE IN 46122-7982
596 HICKORY DR
DANVILLE IN 46122-1460
DANVILLE IN 46122-1460
303 S CROSS ST
DANVILLE IN 46122-1731
DANVILLE IN 46122-1731
56 W POPLAR ST
DANVILLE IN 46122-1634
DANVILLE IN 46122-1634
Map
Hover over the map to see the ZIP code
Census data for DANVILLE, IN
Demographic and housing estimates in DANVILLE, IN
| Total population | 9,791 |
| Male | 4,783 |
| Female | 5,008 |
| Total population | 9,791 |
| Under 5 years | 522 |
| 5 to 9 years | 771 |
| 10 to 14 years | 755 |
| 15 to 19 years | 747 |
| 20 to 24 years | 902 |
| 25 to 34 years | 915 |
| 35 to 44 years | 1,570 |
| 45 to 54 years | 1,177 |
| 55 to 59 years | 641 |
| 60 to 64 years | 425 |
| 65 to 74 years | 886 |
| 75 to 84 years | 359 |
| 85 years and over | 121 |
| Median age (years) | 37.9 |
| Under 18 years | 2,496 |
| 16 years and over | 7,550 |
| 18 years and over | 7,295 |
| 21 years and over | 6,778 |
| 62 years and over | 1,592 |
| 65 years and over | 1,366 |
| Total population | 9,791 |
| One race | 9,767 |
| White | 9,141 |
| Black or African American | 315 |
| American Indian and Alaska Native | 0 |
| Asian | 311 |
| Native Hawaiian and Other Pacific Islander | 0 |
| Some other race | 0 |
| Two or more races | 24 |
| Citizen, VOTING AGE 18 and over population | 7,181 |
| Male Citizen, VOTING AGE 18 and over population | 3,382 |
| Female Citizen, VOTING AGE 18 and over population | 3,799 |
Social characteristics in DANVILLE, IN
| Total households | 3,633 |
| Family households (families) | 2,502 |
| Married-couple family | 2,139 |
| Male householder, no wife present, family | 20 |
| Female householder, no husband present, family | 343 |
| Nonfamily households | 1,131 |
| Average household size | 2.67 |
| Average family size | 3.25 |
Economic characteristics in DANVILLE, IN
| Total households | 3,633 |
| Less than $10,000 | 167 |
| $10,000 to $14,999 | 69 |
| $15,000 to $24,999 | 397 |
| $25,000 to $34,999 | 192 |
| $35,000 to $49,999 | 401 |
| $50,000 to $74,999 | 579 |
| $75,000 to $99,999 | 639 |
| $100,000 to $149,999 | 896 |
| $150,000 to $199,999 | 135 |
| $200,000 or more | 158 |
| Median household income (dollars) | 75,653 |
Housing characteristics in DANVILLE, IN
| Total housing units | 3,797 |
| Occupied housing units | 3,633 |
| Vacant housing units | 164 |
| Total housing units | 3,797 |
| 1-unit, detached | 2,739 |
| 1-unit, attached | 200 |
| 2 units | 175 |
| 3 or 4 units | 255 |
| 5 to 9 units | 294 |
| 10 to 19 units | 87 |
| 20 or more units | 47 |
| Mobile home | 0 |
| Boat, RV, van, etc. | 0 |
| Total housing units | 3,797 |
| Built 2014 or later | 145 |
| Built 2010 to 2013 | 127 |
| Built 2000 to 2009 | 930 |
| Built 1990 to 1999 | 878 |
| Built 1980 to 1989 | 207 |
| Built 1970 to 1979 | 281 |
| Built 1960 to 1969 | 297 |
| Built 1950 to 1959 | 319 |
| Built 1940 to 1949 | 103 |
| Built 1939 or earlier | 510 |
| Total housing units | 3,797 |
| 1 room | 82 |
| 2 rooms | 40 |
| 3 rooms | 177 |
| 4 rooms | 511 |
| 5 rooms | 783 |
| 6 rooms | 663 |
| 7 rooms | 715 |
| 8 rooms | 304 |
| 9 rooms or more | 522 |
| Median rooms | 6.0 |
| Total housing units | 3,797 |
| No bedroom | 95 |
| 1 bedroom | 239 |
| 2 bedrooms | 903 |
| 3 bedrooms | 1,704 |
| 4 bedrooms | 697 |
| 5 or more bedrooms | 159 |
| Occupied housing units | 3,633 |
| Owner-occupied | 2,457 |
| Renter-occupied | 1,176 |
| Average household size of owner-occupied unit | 3.00 |
| Average household size of renter-occupied unit | 1.98 |
| Occupied housing units | 3,633 |
| Moved in 2017 or later | 204 |
| Moved in 2015 to 2016 | 588 |
| Moved in 2010 to 2014 | 966 |
| Moved in 2000 to 2009 | 1,239 |
| Moved in 1990 to 1999 | 455 |
| Moved in 1989 and earlier | 181 |
| Owner-occupied units | 2,457 |
| Less than $50,000 | 38 |
| $50,000 to $99,999 | 92 |
| $100,000 to $149,999 | 955 |
| $150,000 to $199,999 | 647 |
| $200,000 to $299,999 | 417 |
| $300,000 to $499,999 | 179 |
| $500,000 to $999,999 | 129 |
| $1,000,000 or more | 0 |
| Median (dollars) | 158,700 |
| Owner-occupied units | 2,457 |
| Housing units with a mortgage | 1,969 |
| Housing units without a mortgage | 488 |
| Occupied units paying rent | 1,058 |
| Less than $500 | 69 |
| $500 to $999 | 583 |
| $1,000 to $1,499 | 364 |
| $1,500 to $1,999 | 42 |
| $2,000 to $2,499 | 0 |
| $2,500 to $2,999 | 0 |
| $3,000 or more | 0 |
| Median (dollars) | 857 |
| No rent paid | 118 |
Data is based on 2018 Census
ZIP Codes for other locations
State for DANVILLE
Indiana ZIP CodesOther cities in Indiana