DELPHI, IN ZIP Code
| City | DELPHI |
| State | Indiana |
| ZIP Codes count | 1 (see all) |
| Post offices count | 1 (see all) |
| Total population | 3,139 (see all) |
ZIP Code in DELPHI, Indiana
46923
This list contains only 5-digit ZIP codes. Use our zip code lookup by address feature to get the full 9-digit (ZIP+4) code.
List of DELPHI, IN ZIP Codes
| ZIP | TYPE | POPU |
|---|---|---|
| 46923 | STANDARD | 8,200 |
Post offices
DELPHI — Post Office™ 201 W FRANKLIN ST DELPHI, IN 46923-9998 |
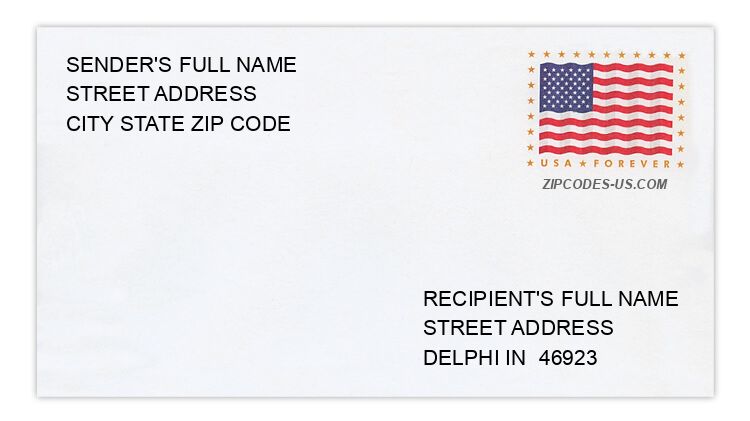
Envelope example
On the bottom center of the envelope, write the address you want your letter delivered to. Include the following on separate lines:
- Recipient's full name
- Full street address
- City, State, and ZIP Code
Using the same format, write the return address in the top left corner.
Using the full ZIP+4 Code when mailing via the USPS ensures the fastest, most accurate mailing possible. If you are not sure of the full 9-digit ZIP Code, use the 5-digit ZIP Code to avoid loss of letter or package.
The recipient address information is provided for your reference.
Address example
8605 N 68 E
DELPHI IN 46923-8350
DELPHI IN 46923-8350
6982 N EAST ROCKFIELD RD
DELPHI IN 46923-9048
DELPHI IN 46923-9048
188 N WABASH ST
DELPHI IN 46923-1461
DELPHI IN 46923-1461
199 PACKETT AVE
DELPHI IN 46923-1048
DELPHI IN 46923-1048
3807 SAMUEL MILROY RD
DELPHI IN 46923-1266
DELPHI IN 46923-1266
4634 W 375 N
DELPHI IN 46923-9176
DELPHI IN 46923-9176
Map
Hover over the map to see the ZIP code
Census data for DELPHI, IN
Demographic and housing estimates in DELPHI, IN
| Total population | 3,139 |
| Male | 1,599 |
| Female | 1,540 |
| Total population | 3,139 |
| Under 5 years | 129 |
| 5 to 9 years | 97 |
| 10 to 14 years | 286 |
| 15 to 19 years | 303 |
| 20 to 24 years | 132 |
| 25 to 34 years | 253 |
| 35 to 44 years | 534 |
| 45 to 54 years | 448 |
| 55 to 59 years | 168 |
| 60 to 64 years | 169 |
| 65 to 74 years | 323 |
| 75 to 84 years | 147 |
| 85 years and over | 150 |
| Median age (years) | 40.5 |
| Under 18 years | 737 |
| 16 years and over | 2,529 |
| 18 years and over | 2,402 |
| 21 years and over | 2,299 |
| 62 years and over | 756 |
| 65 years and over | 620 |
| Total population | 3,139 |
| One race | 3,120 |
| White | 2,819 |
| Black or African American | 22 |
| American Indian and Alaska Native | 11 |
| Asian | 0 |
| Native Hawaiian and Other Pacific Islander | 0 |
| Some other race | 268 |
| Two or more races | 19 |
| Citizen, VOTING AGE 18 and over population | 2,148 |
| Male Citizen, VOTING AGE 18 and over population | 999 |
| Female Citizen, VOTING AGE 18 and over population | 1,149 |
Social characteristics in DELPHI, IN
| Total households | 1,202 |
| Family households (families) | 727 |
| Married-couple family | 513 |
| Male householder, no wife present, family | 59 |
| Female householder, no husband present, family | 155 |
| Nonfamily households | 475 |
| Average household size | 2.52 |
| Average family size | 3.24 |
Economic characteristics in DELPHI, IN
| Total households | 1,202 |
| Less than $10,000 | 62 |
| $10,000 to $14,999 | 75 |
| $15,000 to $24,999 | 183 |
| $25,000 to $34,999 | 192 |
| $35,000 to $49,999 | 183 |
| $50,000 to $74,999 | 226 |
| $75,000 to $99,999 | 140 |
| $100,000 to $149,999 | 121 |
| $150,000 to $199,999 | 8 |
| $200,000 or more | 12 |
| Median household income (dollars) | 43,594 |
Housing characteristics in DELPHI, IN
| Total housing units | 1,416 |
| Occupied housing units | 1,202 |
| Vacant housing units | 214 |
| Total housing units | 1,416 |
| 1-unit, detached | 1,089 |
| 1-unit, attached | 26 |
| 2 units | 115 |
| 3 or 4 units | 34 |
| 5 to 9 units | 7 |
| 10 to 19 units | 63 |
| 20 or more units | 23 |
| Mobile home | 59 |
| Boat, RV, van, etc. | 0 |
| Total housing units | 1,416 |
| Built 2014 or later | 20 |
| Built 2010 to 2013 | 0 |
| Built 2000 to 2009 | 92 |
| Built 1990 to 1999 | 125 |
| Built 1980 to 1989 | 87 |
| Built 1970 to 1979 | 132 |
| Built 1960 to 1969 | 102 |
| Built 1950 to 1959 | 106 |
| Built 1940 to 1949 | 126 |
| Built 1939 or earlier | 626 |
| Total housing units | 1,416 |
| 1 room | 44 |
| 2 rooms | 6 |
| 3 rooms | 87 |
| 4 rooms | 165 |
| 5 rooms | 274 |
| 6 rooms | 288 |
| 7 rooms | 203 |
| 8 rooms | 135 |
| 9 rooms or more | 214 |
| Median rooms | 6.0 |
| Total housing units | 1,416 |
| No bedroom | 47 |
| 1 bedroom | 130 |
| 2 bedrooms | 321 |
| 3 bedrooms | 735 |
| 4 bedrooms | 142 |
| 5 or more bedrooms | 41 |
| Occupied housing units | 1,202 |
| Owner-occupied | 818 |
| Renter-occupied | 384 |
| Average household size of owner-occupied unit | 2.70 |
| Average household size of renter-occupied unit | 2.14 |
| Occupied housing units | 1,202 |
| Moved in 2017 or later | 68 |
| Moved in 2015 to 2016 | 103 |
| Moved in 2010 to 2014 | 380 |
| Moved in 2000 to 2009 | 255 |
| Moved in 1990 to 1999 | 143 |
| Moved in 1989 and earlier | 253 |
| Owner-occupied units | 818 |
| Less than $50,000 | 122 |
| $50,000 to $99,999 | 455 |
| $100,000 to $149,999 | 120 |
| $150,000 to $199,999 | 87 |
| $200,000 to $299,999 | 26 |
| $300,000 to $499,999 | 8 |
| $500,000 to $999,999 | 0 |
| $1,000,000 or more | 0 |
| Median (dollars) | 80,400 |
| Owner-occupied units | 818 |
| Housing units with a mortgage | 483 |
| Housing units without a mortgage | 335 |
| Occupied units paying rent | 346 |
| Less than $500 | 74 |
| $500 to $999 | 247 |
| $1,000 to $1,499 | 25 |
| $1,500 to $1,999 | 0 |
| $2,000 to $2,499 | 0 |
| $2,500 to $2,999 | 0 |
| $3,000 or more | 0 |
| Median (dollars) | 707 |
| No rent paid | 38 |
Data is based on 2018 Census
ZIP Codes for other locations
State for DELPHI
Indiana ZIP CodesOther cities in Indiana