HOPE, IN ZIP Code
| City | HOPE |
| State | Indiana |
| ZIP Codes count | 1 (see all) |
| Post offices count | 1 (see all) |
| Total population | 2,441 (see all) |
ZIP Code in HOPE, Indiana
47246
This list contains only 5-digit ZIP codes. Use our zip code lookup by address feature to get the full 9-digit (ZIP+4) code.
List of HOPE, IN ZIP Codes
| ZIP | TYPE | POPU |
|---|---|---|
| 47246 | STANDARD | 4,121 |
Post offices
HOPE — Post Office™ 739 MAIN ST HOPE, IN 47246-9998 |
Envelope example
On the bottom center of the envelope, write the address you want your letter delivered to. Include the following on separate lines:
- Recipient's full name
- Full street address
- City, State, and ZIP Code
Using the same format, write the return address in the top left corner.
Using the full ZIP+4 Code when mailing via the USPS ensures the fastest, most accurate mailing possible. If you are not sure of the full 9-digit ZIP Code, use the 5-digit ZIP Code to avoid loss of letter or package.
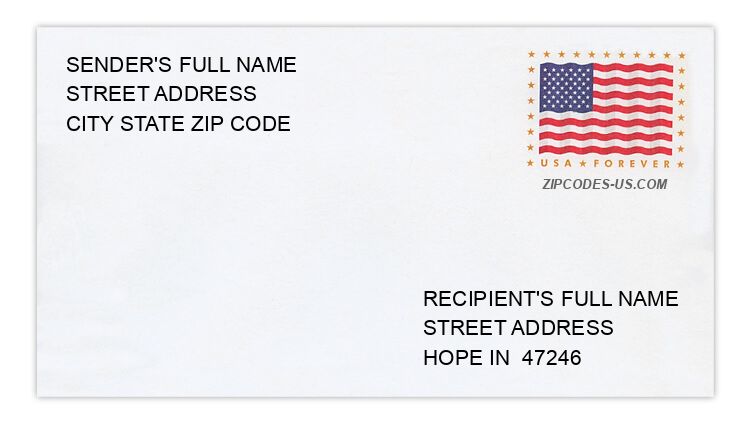
The recipient address information is provided for your reference.
Address example
17963 E COUNTY ROAD 365 N
HOPE IN 47246-9723
HOPE IN 47246-9723
11505 E COUNTY ROAD 885 N
HOPE IN 47246-9608
HOPE IN 47246-9608
123 MIDWAY DR
HOPE IN 47246-9405
HOPE IN 47246-9405
11275 N COUNTY ROAD 425 E
HOPE IN 47246-9626
HOPE IN 47246-9626
4389 N COUNTY ROAD 650 E
HOPE IN 47246-9745
HOPE IN 47246-9745
341 SEMINARY ST
HOPE IN 47246-1544
HOPE IN 47246-1544
Map
Hover over the map to see the ZIP code
Census data for HOPE, IN
Demographic and housing estimates in HOPE, IN
| Total population | 2,441 |
| Male | 1,251 |
| Female | 1,190 |
| Total population | 2,441 |
| Under 5 years | 181 |
| 5 to 9 years | 158 |
| 10 to 14 years | 229 |
| 15 to 19 years | 175 |
| 20 to 24 years | 139 |
| 25 to 34 years | 391 |
| 35 to 44 years | 281 |
| 45 to 54 years | 325 |
| 55 to 59 years | 177 |
| 60 to 64 years | 103 |
| 65 to 74 years | 153 |
| 75 to 84 years | 73 |
| 85 years and over | 56 |
| Median age (years) | 33.0 |
| Under 18 years | 691 |
| 16 years and over | 1,831 |
| 18 years and over | 1,750 |
| 21 years and over | 1,664 |
| 62 years and over | 328 |
| 65 years and over | 282 |
| Total population | 2,441 |
| One race | 2,380 |
| White | 2,349 |
| Black or African American | 23 |
| American Indian and Alaska Native | 0 |
| Asian | 0 |
| Native Hawaiian and Other Pacific Islander | 0 |
| Some other race | 8 |
| Two or more races | 61 |
| Citizen, VOTING AGE 18 and over population | 1,735 |
| Male Citizen, VOTING AGE 18 and over population | 847 |
| Female Citizen, VOTING AGE 18 and over population | 888 |
Social characteristics in HOPE, IN
| Total households | 865 |
| Family households (families) | 622 |
| Married-couple family | 437 |
| Male householder, no wife present, family | 66 |
| Female householder, no husband present, family | 119 |
| Nonfamily households | 243 |
| Average household size | 2.82 |
| Average family size | 3.34 |
Economic characteristics in HOPE, IN
| Total households | 865 |
| Less than $10,000 | 42 |
| $10,000 to $14,999 | 21 |
| $15,000 to $24,999 | 78 |
| $25,000 to $34,999 | 118 |
| $35,000 to $49,999 | 174 |
| $50,000 to $74,999 | 219 |
| $75,000 to $99,999 | 149 |
| $100,000 to $149,999 | 52 |
| $150,000 to $199,999 | 5 |
| $200,000 or more | 7 |
| Median household income (dollars) | 49,922 |
Housing characteristics in HOPE, IN
| Total housing units | 950 |
| Occupied housing units | 865 |
| Vacant housing units | 85 |
| Total housing units | 950 |
| 1-unit, detached | 813 |
| 1-unit, attached | 19 |
| 2 units | 0 |
| 3 or 4 units | 14 |
| 5 to 9 units | 21 |
| 10 to 19 units | 0 |
| 20 or more units | 0 |
| Mobile home | 83 |
| Boat, RV, van, etc. | 0 |
| Total housing units | 950 |
| Built 2014 or later | 0 |
| Built 2010 to 2013 | 8 |
| Built 2000 to 2009 | 41 |
| Built 1990 to 1999 | 83 |
| Built 1980 to 1989 | 98 |
| Built 1970 to 1979 | 206 |
| Built 1960 to 1969 | 63 |
| Built 1950 to 1959 | 116 |
| Built 1940 to 1949 | 79 |
| Built 1939 or earlier | 256 |
| Total housing units | 950 |
| 1 room | 8 |
| 2 rooms | 0 |
| 3 rooms | 27 |
| 4 rooms | 124 |
| 5 rooms | 302 |
| 6 rooms | 249 |
| 7 rooms | 102 |
| 8 rooms | 57 |
| 9 rooms or more | 81 |
| Median rooms | 5.6 |
| Total housing units | 950 |
| No bedroom | 8 |
| 1 bedroom | 45 |
| 2 bedrooms | 255 |
| 3 bedrooms | 528 |
| 4 bedrooms | 96 |
| 5 or more bedrooms | 18 |
| Occupied housing units | 865 |
| Owner-occupied | 661 |
| Renter-occupied | 204 |
| Average household size of owner-occupied unit | 2.89 |
| Average household size of renter-occupied unit | 2.60 |
| Occupied housing units | 865 |
| Moved in 2017 or later | 42 |
| Moved in 2015 to 2016 | 95 |
| Moved in 2010 to 2014 | 209 |
| Moved in 2000 to 2009 | 250 |
| Moved in 1990 to 1999 | 103 |
| Moved in 1989 and earlier | 166 |
| Owner-occupied units | 661 |
| Less than $50,000 | 78 |
| $50,000 to $99,999 | 370 |
| $100,000 to $149,999 | 147 |
| $150,000 to $199,999 | 53 |
| $200,000 to $299,999 | 9 |
| $300,000 to $499,999 | 4 |
| $500,000 to $999,999 | 0 |
| $1,000,000 or more | 0 |
| Median (dollars) | 80,500 |
| Owner-occupied units | 661 |
| Housing units with a mortgage | 464 |
| Housing units without a mortgage | 197 |
| Occupied units paying rent | 178 |
| Less than $500 | 13 |
| $500 to $999 | 151 |
| $1,000 to $1,499 | 14 |
| $1,500 to $1,999 | 0 |
| $2,000 to $2,499 | 0 |
| $2,500 to $2,999 | 0 |
| $3,000 or more | 0 |
| Median (dollars) | 800 |
| No rent paid | 26 |
Data is based on 2018 Census
ZIP Codes for other locations
State for HOPE
Indiana ZIP CodesOther cities in Indiana