ANACONDA, MT ZIP Code
| City | ANACONDA |
| State | Montana |
| ZIP Codes count | 1 (see all) |
| Post offices count | 1 (see all) |
ZIP Code in ANACONDA, Montana
59711
This list contains only 5-digit ZIP codes. Use our zip code lookup by address feature to get the full 9-digit (ZIP+4) code.
List of ANACONDA, MT ZIP Codes
| ZIP | TYPE | POPU |
|---|---|---|
| 59711 | STANDARD | 9,371 |
Post offices
ANACONDA — Post Office™ 218 MAIN ST ANACONDA, MT 59711-9998 |
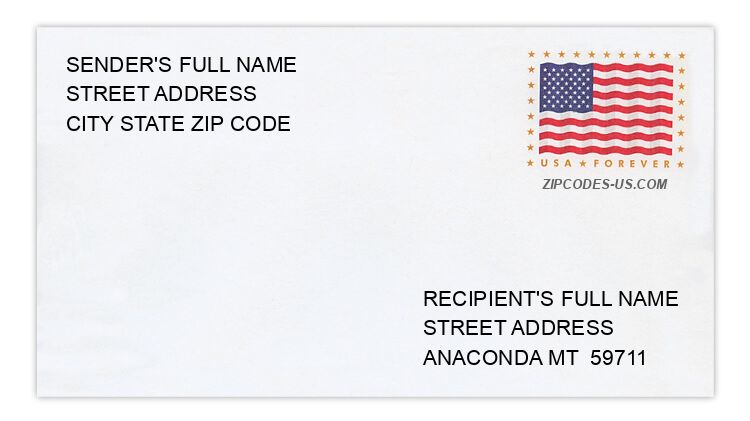
Envelope example
On the bottom center of the envelope, write the address you want your letter delivered to. Include the following on separate lines:
- Recipient's full name
- Full street address
- City, State, and ZIP Code
Using the same format, write the return address in the top left corner.
Using the full ZIP+4 Code when mailing via the USPS ensures the fastest, most accurate mailing possible. If you are not sure of the full 9-digit ZIP Code, use the 5-digit ZIP Code to avoid loss of letter or package.
The recipient address information is provided for your reference.
Address example
56 BIG SKY DR
ANACONDA MT 59711-2099
ANACONDA MT 59711-2099
111 CHARTER DR
ANACONDA MT 59711-9551
ANACONDA MT 59711-9551
141 DUDE RANCH LN
ANACONDA MT 59711-9022
ANACONDA MT 59711-9022
367 GARRITY DR
ANACONDA MT 59711-1987
ANACONDA MT 59711-1987
211 MACLUND DR
ANACONDA MT 59711-6247
ANACONDA MT 59711-6247
1521 STEWART ST
ANACONDA MT 59711-9335
ANACONDA MT 59711-9335
Map
Hover over the map to see the ZIP code
ZIP Codes for other locations
State for ANACONDA
Montana ZIP CodesOther cities in Montana