KALISPELL, MT ZIP Code
| City | KALISPELL |
| State | Montana |
| ZIP Codes count | 3 (see all) |
| Post offices count | 2 (see all) |
| Total population | 22,621 (see all) |
ZIP Codes in KALISPELL, Montana
59901, 59903, 59904
This list contains only 5-digit ZIP codes. Use our zip code lookup by address feature to get the full 9-digit (ZIP+4) code.
List of KALISPELL, MT ZIP Codes
| ZIP | TYPE | POPU |
|---|---|---|
| 59901 | STANDARD | 58,212 |
| 59903 | PO BOX | – |
| 59904 | PO BOX | – |
Post offices
FLATHEAD — Post Office™ 248 1ST AVE W KALISPELL, MT 59901-4465 |
KALISPELL — Post Office™ 350 N MERIDIAN RD KALISPELL, MT 59901-9998 |
Envelope example
On the bottom center of the envelope, write the address you want your letter delivered to. Include the following on separate lines:
- Recipient's full name
- Full street address
- City, State, and ZIP Code
Using the same format, write the return address in the top left corner.
Using the full ZIP+4 Code when mailing via the USPS ensures the fastest, most accurate mailing possible. If you are not sure of the full 9-digit ZIP Code, use the 5-digit ZIP Code to avoid loss of letter or package.
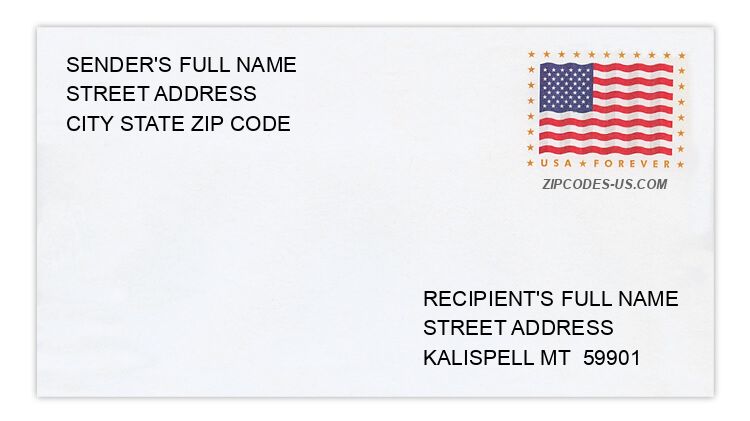
The recipient address information is provided for your reference.
Address example
1445 1ST AVE W
KALISPELL MT 59901-5704
KALISPELL MT 59901-5704
12 ASPEN CT
KALISPELL MT 59901-6688
KALISPELL MT 59901-6688
1088 BARN OWL DR
KALISPELL MT 59901-6126
KALISPELL MT 59901-6126
138 BERNARD RD
KALISPELL MT 59901-2407
KALISPELL MT 59901-2407
2826 DANFORD LN
KALISPELL MT 59901-9081
KALISPELL MT 59901-9081
2090 WILLOW GLEN TRL
KALISPELL MT 59901-5181
KALISPELL MT 59901-5181
Map
Hover over the map to see the ZIP code
Census data for KALISPELL, MT
Demographic and housing estimates in KALISPELL, MT
| Total population | 22,621 |
| Male | 11,187 |
| Female | 11,434 |
| Total population | 22,621 |
| Under 5 years | 1,492 |
| 5 to 9 years | 1,217 |
| 10 to 14 years | 1,889 |
| 15 to 19 years | 1,526 |
| 20 to 24 years | 1,488 |
| 25 to 34 years | 3,272 |
| 35 to 44 years | 3,035 |
| 45 to 54 years | 2,442 |
| 55 to 59 years | 1,221 |
| 60 to 64 years | 1,365 |
| 65 to 74 years | 1,798 |
| 75 to 84 years | 1,406 |
| 85 years and over | 470 |
| Median age (years) | 35.9 |
| Under 18 years | 5,595 |
| 16 years and over | 17,742 |
| 18 years and over | 17,026 |
| 21 years and over | 16,125 |
| 62 years and over | 4,510 |
| 65 years and over | 3,674 |
| Total population | 22,621 |
| One race | 22,153 |
| White | 21,437 |
| Black or African American | 128 |
| American Indian and Alaska Native | 252 |
| Asian | 275 |
| Native Hawaiian and Other Pacific Islander | 0 |
| Some other race | 61 |
| Two or more races | 468 |
| Citizen, VOTING AGE 18 and over population | 16,869 |
| Male Citizen, VOTING AGE 18 and over population | 8,355 |
| Female Citizen, VOTING AGE 18 and over population | 8,514 |
Social characteristics in KALISPELL, MT
| Total households | 8,945 |
| Family households (families) | 5,156 |
| Married-couple family | 3,890 |
| Male householder, no wife present, family | 372 |
| Female householder, no husband present, family | 894 |
| Nonfamily households | 3,789 |
| Average household size | 2.48 |
| Average family size | 3.18 |
Economic characteristics in KALISPELL, MT
| Total households | 8,945 |
| Less than $10,000 | 575 |
| $10,000 to $14,999 | 606 |
| $15,000 to $24,999 | 1,111 |
| $25,000 to $34,999 | 981 |
| $35,000 to $49,999 | 1,440 |
| $50,000 to $74,999 | 1,843 |
| $75,000 to $99,999 | 1,045 |
| $100,000 to $149,999 | 969 |
| $150,000 to $199,999 | 183 |
| $200,000 or more | 192 |
| Median household income (dollars) | 47,362 |
Housing characteristics in KALISPELL, MT
| Total housing units | 9,457 |
| Occupied housing units | 8,945 |
| Vacant housing units | 512 |
| Total housing units | 9,457 |
| 1-unit, detached | 5,503 |
| 1-unit, attached | 979 |
| 2 units | 452 |
| 3 or 4 units | 660 |
| 5 to 9 units | 445 |
| 10 to 19 units | 391 |
| 20 or more units | 711 |
| Mobile home | 316 |
| Boat, RV, van, etc. | 0 |
| Total housing units | 9,457 |
| Built 2014 or later | 124 |
| Built 2010 to 2013 | 254 |
| Built 2000 to 2009 | 2,027 |
| Built 1990 to 1999 | 1,248 |
| Built 1980 to 1989 | 1,026 |
| Built 1970 to 1979 | 1,460 |
| Built 1960 to 1969 | 590 |
| Built 1950 to 1959 | 871 |
| Built 1940 to 1949 | 483 |
| Built 1939 or earlier | 1,374 |
| Total housing units | 9,457 |
| 1 room | 286 |
| 2 rooms | 278 |
| 3 rooms | 1,356 |
| 4 rooms | 1,443 |
| 5 rooms | 1,902 |
| 6 rooms | 1,505 |
| 7 rooms | 1,055 |
| 8 rooms | 659 |
| 9 rooms or more | 973 |
| Median rooms | 5.2 |
| Total housing units | 9,457 |
| No bedroom | 305 |
| 1 bedroom | 1,281 |
| 2 bedrooms | 2,837 |
| 3 bedrooms | 3,379 |
| 4 bedrooms | 1,287 |
| 5 or more bedrooms | 368 |
| Occupied housing units | 8,945 |
| Owner-occupied | 4,953 |
| Renter-occupied | 3,992 |
| Average household size of owner-occupied unit | 2.54 |
| Average household size of renter-occupied unit | 2.40 |
| Occupied housing units | 8,945 |
| Moved in 2017 or later | 537 |
| Moved in 2015 to 2016 | 1,318 |
| Moved in 2010 to 2014 | 3,442 |
| Moved in 2000 to 2009 | 2,248 |
| Moved in 1990 to 1999 | 814 |
| Moved in 1989 and earlier | 586 |
| Owner-occupied units | 4,953 |
| Less than $50,000 | 117 |
| $50,000 to $99,999 | 121 |
| $100,000 to $149,999 | 500 |
| $150,000 to $199,999 | 1,372 |
| $200,000 to $299,999 | 2,120 |
| $300,000 to $499,999 | 538 |
| $500,000 to $999,999 | 142 |
| $1,000,000 or more | 43 |
| Median (dollars) | 214,100 |
| Owner-occupied units | 4,953 |
| Housing units with a mortgage | 3,398 |
| Housing units without a mortgage | 1,555 |
| Occupied units paying rent | 3,919 |
| Less than $500 | 876 |
| $500 to $999 | 1,939 |
| $1,000 to $1,499 | 905 |
| $1,500 to $1,999 | 159 |
| $2,000 to $2,499 | 40 |
| $2,500 to $2,999 | 0 |
| $3,000 or more | 0 |
| Median (dollars) | 755 |
| No rent paid | 73 |
Data is based on 2018 Census
ZIP Codes for other locations
State for KALISPELL
Montana ZIP CodesOther cities in Montana