SIDNEY, MT ZIP Code
| City | SIDNEY |
| State | Montana |
| ZIP Codes count | 1 (see all) |
| Post offices count | 1 (see all) |
| Total population | 6,475 (see all) |
ZIP Code in SIDNEY, Montana
59270
This list contains only 5-digit ZIP codes. Use our zip code lookup by address feature to get the full 9-digit (ZIP+4) code.
List of SIDNEY, MT ZIP Codes
| ZIP | TYPE | POPU |
|---|---|---|
| 59270 | STANDARD | 8,803 |
Post offices
SIDNEY — Post Office™ 101 W HOLLY ST SIDNEY, MT 59270-9998 |
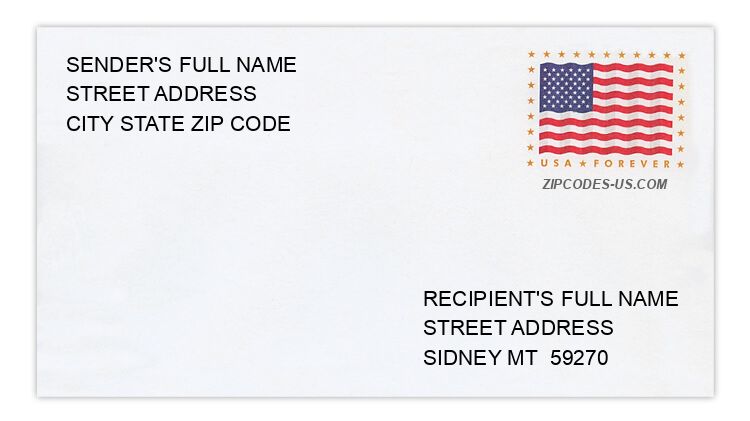
Envelope example
On the bottom center of the envelope, write the address you want your letter delivered to. Include the following on separate lines:
- Recipient's full name
- Full street address
- City, State, and ZIP Code
Using the same format, write the return address in the top left corner.
Using the full ZIP+4 Code when mailing via the USPS ensures the fastest, most accurate mailing possible. If you are not sure of the full 9-digit ZIP Code, use the 5-digit ZIP Code to avoid loss of letter or package.
The recipient address information is provided for your reference.
Address example
258 21ST AVE NW
SIDNEY MT 59270-5721
SIDNEY MT 59270-5721
117 4TH AVE SE
SIDNEY MT 59270-4615
SIDNEY MT 59270-4615
134 8TH AVE NW
SIDNEY MT 59270-3824
SIDNEY MT 59270-3824
12235 COUNTY ROAD 347C
SIDNEY MT 59270-6401
SIDNEY MT 59270-6401
1884 GOLDEN ROD LN
SIDNEY MT 59270-5619
SIDNEY MT 59270-5619
173 MILLER ST NE
SIDNEY MT 59270-4223
SIDNEY MT 59270-4223
Map
Hover over the map to see the ZIP code
Census data for SIDNEY, MT
Demographic and housing estimates in SIDNEY, MT
| Total population | 6,475 |
| Male | 3,228 |
| Female | 3,247 |
| Total population | 6,475 |
| Under 5 years | 459 |
| 5 to 9 years | 401 |
| 10 to 14 years | 530 |
| 15 to 19 years | 468 |
| 20 to 24 years | 379 |
| 25 to 34 years | 917 |
| 35 to 44 years | 906 |
| 45 to 54 years | 796 |
| 55 to 59 years | 389 |
| 60 to 64 years | 389 |
| 65 to 74 years | 514 |
| 75 to 84 years | 132 |
| 85 years and over | 195 |
| Median age (years) | 35.8 |
| Under 18 years | 1,620 |
| 16 years and over | 5,059 |
| 18 years and over | 4,855 |
| 21 years and over | 4,587 |
| 62 years and over | 1,054 |
| 65 years and over | 841 |
| Total population | 6,475 |
| One race | 6,299 |
| White | 6,069 |
| Black or African American | 0 |
| American Indian and Alaska Native | 207 |
| Asian | 0 |
| Native Hawaiian and Other Pacific Islander | 0 |
| Some other race | 23 |
| Two or more races | 176 |
| Citizen, VOTING AGE 18 and over population | 4,712 |
| Male Citizen, VOTING AGE 18 and over population | 2,333 |
| Female Citizen, VOTING AGE 18 and over population | 2,379 |
Social characteristics in SIDNEY, MT
| Total households | 2,543 |
| Family households (families) | 1,502 |
| Married-couple family | 1,099 |
| Male householder, no wife present, family | 173 |
| Female householder, no husband present, family | 230 |
| Nonfamily households | 1,041 |
| Average household size | 2.52 |
| Average family size | 3.32 |
Economic characteristics in SIDNEY, MT
| Total households | 2,543 |
| Less than $10,000 | 62 |
| $10,000 to $14,999 | 123 |
| $15,000 to $24,999 | 200 |
| $25,000 to $34,999 | 252 |
| $35,000 to $49,999 | 370 |
| $50,000 to $74,999 | 575 |
| $75,000 to $99,999 | 375 |
| $100,000 to $149,999 | 372 |
| $150,000 to $199,999 | 134 |
| $200,000 or more | 80 |
| Median household income (dollars) | 60,716 |
Housing characteristics in SIDNEY, MT
| Total housing units | 2,923 |
| Occupied housing units | 2,543 |
| Vacant housing units | 380 |
| Total housing units | 2,923 |
| 1-unit, detached | 1,789 |
| 1-unit, attached | 51 |
| 2 units | 61 |
| 3 or 4 units | 199 |
| 5 to 9 units | 243 |
| 10 to 19 units | 39 |
| 20 or more units | 145 |
| Mobile home | 391 |
| Boat, RV, van, etc. | 5 |
| Total housing units | 2,923 |
| Built 2014 or later | 104 |
| Built 2010 to 2013 | 241 |
| Built 2000 to 2009 | 158 |
| Built 1990 to 1999 | 117 |
| Built 1980 to 1989 | 301 |
| Built 1970 to 1979 | 839 |
| Built 1960 to 1969 | 193 |
| Built 1950 to 1959 | 417 |
| Built 1940 to 1949 | 124 |
| Built 1939 or earlier | 429 |
| Total housing units | 2,923 |
| 1 room | 148 |
| 2 rooms | 14 |
| 3 rooms | 197 |
| 4 rooms | 635 |
| 5 rooms | 558 |
| 6 rooms | 427 |
| 7 rooms | 272 |
| 8 rooms | 202 |
| 9 rooms or more | 470 |
| Median rooms | 5.3 |
| Total housing units | 2,923 |
| No bedroom | 148 |
| 1 bedroom | 240 |
| 2 bedrooms | 876 |
| 3 bedrooms | 1,005 |
| 4 bedrooms | 468 |
| 5 or more bedrooms | 186 |
| Occupied housing units | 2,543 |
| Owner-occupied | 1,483 |
| Renter-occupied | 1,060 |
| Average household size of owner-occupied unit | 2.63 |
| Average household size of renter-occupied unit | 2.37 |
| Occupied housing units | 2,543 |
| Moved in 2017 or later | 132 |
| Moved in 2015 to 2016 | 434 |
| Moved in 2010 to 2014 | 954 |
| Moved in 2000 to 2009 | 438 |
| Moved in 1990 to 1999 | 261 |
| Moved in 1989 and earlier | 324 |
| Owner-occupied units | 1,483 |
| Less than $50,000 | 94 |
| $50,000 to $99,999 | 142 |
| $100,000 to $149,999 | 209 |
| $150,000 to $199,999 | 207 |
| $200,000 to $299,999 | 593 |
| $300,000 to $499,999 | 230 |
| $500,000 to $999,999 | 0 |
| $1,000,000 or more | 8 |
| Median (dollars) | 213,000 |
| Owner-occupied units | 1,483 |
| Housing units with a mortgage | 649 |
| Housing units without a mortgage | 834 |
| Occupied units paying rent | 930 |
| Less than $500 | 148 |
| $500 to $999 | 512 |
| $1,000 to $1,499 | 173 |
| $1,500 to $1,999 | 91 |
| $2,000 to $2,499 | 6 |
| $2,500 to $2,999 | 0 |
| $3,000 or more | 0 |
| Median (dollars) | 819 |
| No rent paid | 130 |
Data is based on 2018 Census
ZIP Codes for other locations
State for SIDNEY
Montana ZIP CodesOther cities in Montana