MOLALLA, OR ZIP Code
| City | MOLALLA |
| State | Oregon |
| ZIP Codes count | 1 (see all) |
| Post offices count | 1 (see all) |
| Total population | 9,082 (see all) |
ZIP Code in MOLALLA, Oregon
97038
This list contains only 5-digit ZIP codes. Use our zip code lookup by address feature to get the full 9-digit (ZIP+4) code.
List of MOLALLA, OR ZIP Codes
| ZIP | TYPE | POPU |
|---|---|---|
| 97038 | STANDARD | 16,429 |
Post offices
MOLALLA — Post Office™ 215 ROBBINS ST MOLALLA, OR 97038-7038 |
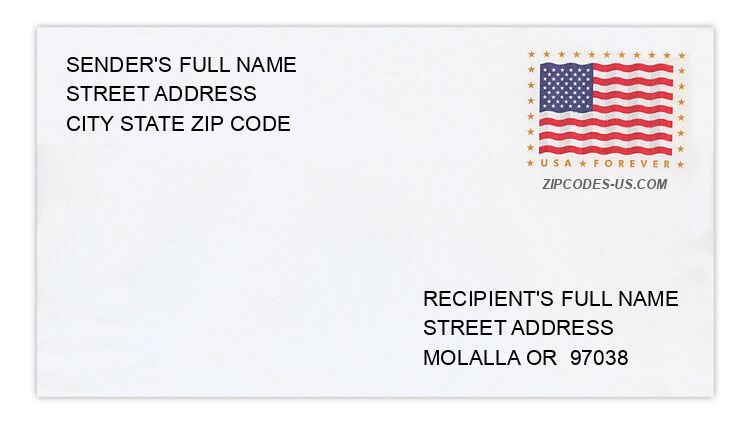
Envelope example
On the bottom center of the envelope, write the address you want your letter delivered to. Include the following on separate lines:
- Recipient's full name
- Full street address
- City, State, and ZIP Code
Using the same format, write the return address in the top left corner.
Using the full ZIP+4 Code when mailing via the USPS ensures the fastest, most accurate mailing possible. If you are not sure of the full 9-digit ZIP Code, use the 5-digit ZIP Code to avoid loss of letter or package.
The recipient address information is provided for your reference.
Address example
212 MARSON CT
MOLALLA OR 97038-8139
MOLALLA OR 97038-8139
410 METZLER ST
MOLALLA OR 97038-9103
MOLALLA OR 97038-9103
600 PENNSYLVANIA CT
MOLALLA OR 97038-7379
MOLALLA OR 97038-7379
16175 S FOREST HAVEN RD
MOLALLA OR 97038-8484
MOLALLA OR 97038-8484
30299 S MEADOWBROOK LN
MOLALLA OR 97038-7621
MOLALLA OR 97038-7621
13222 S MOLALLA FOREST RD
MOLALLA OR 97038-8471
MOLALLA OR 97038-8471
Map
Hover over the map to see the ZIP code
Census data for MOLALLA, OR
Demographic and housing estimates in MOLALLA, OR
| Total population | 9,082 |
| Male | 4,702 |
| Female | 4,380 |
| Total population | 9,082 |
| Under 5 years | 966 |
| 5 to 9 years | 606 |
| 10 to 14 years | 863 |
| 15 to 19 years | 658 |
| 20 to 24 years | 375 |
| 25 to 34 years | 1,243 |
| 35 to 44 years | 1,374 |
| 45 to 54 years | 982 |
| 55 to 59 years | 596 |
| 60 to 64 years | 489 |
| 65 to 74 years | 595 |
| 75 to 84 years | 269 |
| 85 years and over | 66 |
| Median age (years) | 33.7 |
| Under 18 years | 2,768 |
| 16 years and over | 6,521 |
| 18 years and over | 6,314 |
| 21 years and over | 5,967 |
| 62 years and over | 1,160 |
| 65 years and over | 930 |
| Total population | 9,082 |
| One race | 8,865 |
| White | 8,112 |
| Black or African American | 19 |
| American Indian and Alaska Native | 51 |
| Asian | 100 |
| Native Hawaiian and Other Pacific Islander | 0 |
| Some other race | 583 |
| Two or more races | 217 |
| Citizen, VOTING AGE 18 and over population | 5,925 |
| Male Citizen, VOTING AGE 18 and over population | 2,919 |
| Female Citizen, VOTING AGE 18 and over population | 3,006 |
Social characteristics in MOLALLA, OR
| Total households | 3,187 |
| Family households (families) | 2,250 |
| Married-couple family | 1,659 |
| Male householder, no wife present, family | 136 |
| Female householder, no husband present, family | 455 |
| Nonfamily households | 937 |
| Average household size | 2.83 |
| Average family size | 3.33 |
Economic characteristics in MOLALLA, OR
| Total households | 3,187 |
| Less than $10,000 | 128 |
| $10,000 to $14,999 | 175 |
| $15,000 to $24,999 | 300 |
| $25,000 to $34,999 | 204 |
| $35,000 to $49,999 | 460 |
| $50,000 to $74,999 | 636 |
| $75,000 to $99,999 | 489 |
| $100,000 to $149,999 | 531 |
| $150,000 to $199,999 | 205 |
| $200,000 or more | 59 |
| Median household income (dollars) | 61,185 |
Housing characteristics in MOLALLA, OR
| Total housing units | 3,341 |
| Occupied housing units | 3,187 |
| Vacant housing units | 154 |
| Total housing units | 3,341 |
| 1-unit, detached | 2,319 |
| 1-unit, attached | 138 |
| 2 units | 170 |
| 3 or 4 units | 137 |
| 5 to 9 units | 135 |
| 10 to 19 units | 88 |
| 20 or more units | 190 |
| Mobile home | 164 |
| Boat, RV, van, etc. | 0 |
| Total housing units | 3,341 |
| Built 2014 or later | 65 |
| Built 2010 to 2013 | 161 |
| Built 2000 to 2009 | 1,114 |
| Built 1990 to 1999 | 830 |
| Built 1980 to 1989 | 211 |
| Built 1970 to 1979 | 288 |
| Built 1960 to 1969 | 140 |
| Built 1950 to 1959 | 129 |
| Built 1940 to 1949 | 88 |
| Built 1939 or earlier | 315 |
| Total housing units | 3,341 |
| 1 room | 117 |
| 2 rooms | 9 |
| 3 rooms | 330 |
| 4 rooms | 597 |
| 5 rooms | 1,035 |
| 6 rooms | 498 |
| 7 rooms | 425 |
| 8 rooms | 160 |
| 9 rooms or more | 170 |
| Median rooms | 5.1 |
| Total housing units | 3,341 |
| No bedroom | 127 |
| 1 bedroom | 115 |
| 2 bedrooms | 836 |
| 3 bedrooms | 1,798 |
| 4 bedrooms | 412 |
| 5 or more bedrooms | 53 |
| Occupied housing units | 3,187 |
| Owner-occupied | 2,197 |
| Renter-occupied | 990 |
| Average household size of owner-occupied unit | 3.00 |
| Average household size of renter-occupied unit | 2.46 |
| Occupied housing units | 3,187 |
| Moved in 2017 or later | 168 |
| Moved in 2015 to 2016 | 484 |
| Moved in 2010 to 2014 | 1,236 |
| Moved in 2000 to 2009 | 867 |
| Moved in 1990 to 1999 | 286 |
| Moved in 1989 and earlier | 146 |
| Owner-occupied units | 2,197 |
| Less than $50,000 | 62 |
| $50,000 to $99,999 | 35 |
| $100,000 to $149,999 | 87 |
| $150,000 to $199,999 | 337 |
| $200,000 to $299,999 | 1,140 |
| $300,000 to $499,999 | 536 |
| $500,000 to $999,999 | 0 |
| $1,000,000 or more | 0 |
| Median (dollars) | 245,000 |
| Owner-occupied units | 2,197 |
| Housing units with a mortgage | 1,786 |
| Housing units without a mortgage | 411 |
| Occupied units paying rent | 958 |
| Less than $500 | 133 |
| $500 to $999 | 367 |
| $1,000 to $1,499 | 321 |
| $1,500 to $1,999 | 116 |
| $2,000 to $2,499 | 10 |
| $2,500 to $2,999 | 0 |
| $3,000 or more | 11 |
| Median (dollars) | 971 |
| No rent paid | 32 |
Data is based on 2018 Census
ZIP Codes for other locations
State for MOLALLA
Oregon ZIP CodesOther cities in Oregon