NYSSA, OR ZIP Code
| City | NYSSA |
| State | Oregon |
| ZIP Codes count | 1 (see all) |
| Post offices count | 1 (see all) |
| Total population | 3,175 (see all) |
ZIP Code in NYSSA, Oregon
97913
This list contains only 5-digit ZIP codes. Use our zip code lookup by address feature to get the full 9-digit (ZIP+4) code.
List of NYSSA, OR ZIP Codes
| ZIP | TYPE | POPU |
|---|---|---|
| 97913 | STANDARD | 5,139 |
Post offices
NYSSA — Post Office™ 16 N 4TH ST NYSSA, OR 97913-3906 |
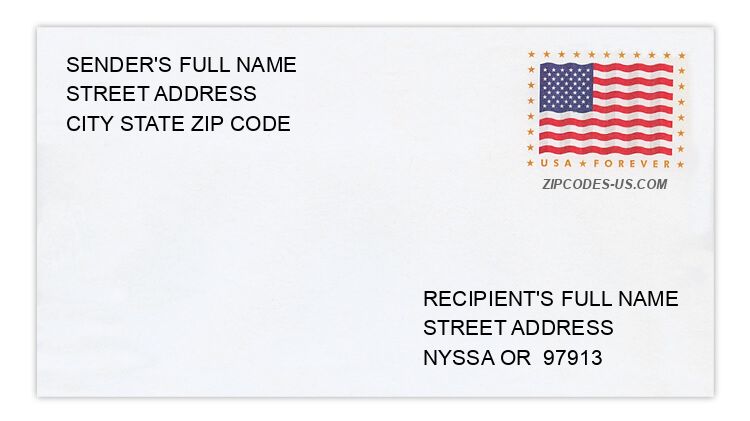
Envelope example
On the bottom center of the envelope, write the address you want your letter delivered to. Include the following on separate lines:
- Recipient's full name
- Full street address
- City, State, and ZIP Code
Using the same format, write the return address in the top left corner.
Using the full ZIP+4 Code when mailing via the USPS ensures the fastest, most accurate mailing possible. If you are not sure of the full 9-digit ZIP Code, use the 5-digit ZIP Code to avoid loss of letter or package.
The recipient address information is provided for your reference.
Address example
652 BEET DUMP RD
NYSSA OR 97913-5504
NYSSA OR 97913-5504
1592 BYBEE LN
NYSSA OR 97913-5121
NYSSA OR 97913-5121
3271 KESLER LN
NYSSA OR 97913-5054
NYSSA OR 97913-5054
420 MAPLE AVE
NYSSA OR 97913-3247
NYSSA OR 97913-3247
204 S 4TH ST
NYSSA OR 97913-3624
NYSSA OR 97913-3624
3340 VICTORIO RD
NYSSA OR 97913-5053
NYSSA OR 97913-5053
Map
Hover over the map to see the ZIP code
Census data for NYSSA, OR
Demographic and housing estimates in NYSSA, OR
| Total population | 3,175 |
| Male | 1,582 |
| Female | 1,593 |
| Total population | 3,175 |
| Under 5 years | 277 |
| 5 to 9 years | 414 |
| 10 to 14 years | 295 |
| 15 to 19 years | 297 |
| 20 to 24 years | 268 |
| 25 to 34 years | 363 |
| 35 to 44 years | 348 |
| 45 to 54 years | 393 |
| 55 to 59 years | 106 |
| 60 to 64 years | 108 |
| 65 to 74 years | 172 |
| 75 to 84 years | 68 |
| 85 years and over | 66 |
| Median age (years) | 26.1 |
| Under 18 years | 1,187 |
| 16 years and over | 2,116 |
| 18 years and over | 1,988 |
| 21 years and over | 1,780 |
| 62 years and over | 385 |
| 65 years and over | 306 |
| Total population | 3,175 |
| One race | 3,113 |
| White | 2,879 |
| Black or African American | 15 |
| American Indian and Alaska Native | 6 |
| Asian | 19 |
| Native Hawaiian and Other Pacific Islander | 0 |
| Some other race | 194 |
| Two or more races | 62 |
| Citizen, VOTING AGE 18 and over population | 1,577 |
| Male Citizen, VOTING AGE 18 and over population | 666 |
| Female Citizen, VOTING AGE 18 and over population | 911 |
Social characteristics in NYSSA, OR
| Total households | 1,043 |
| Family households (families) | 804 |
| Married-couple family | 513 |
| Male householder, no wife present, family | 84 |
| Female householder, no husband present, family | 207 |
| Nonfamily households | 239 |
| Average household size | 3.01 |
| Average family size | 3.45 |
Economic characteristics in NYSSA, OR
| Total households | 1,043 |
| Less than $10,000 | 105 |
| $10,000 to $14,999 | 89 |
| $15,000 to $24,999 | 114 |
| $25,000 to $34,999 | 122 |
| $35,000 to $49,999 | 182 |
| $50,000 to $74,999 | 183 |
| $75,000 to $99,999 | 154 |
| $100,000 to $149,999 | 75 |
| $150,000 to $199,999 | 17 |
| $200,000 or more | 2 |
| Median household income (dollars) | 41,982 |
Housing characteristics in NYSSA, OR
| Total housing units | 1,125 |
| Occupied housing units | 1,043 |
| Vacant housing units | 82 |
| Total housing units | 1,125 |
| 1-unit, detached | 836 |
| 1-unit, attached | 32 |
| 2 units | 19 |
| 3 or 4 units | 38 |
| 5 to 9 units | 47 |
| 10 to 19 units | 10 |
| 20 or more units | 24 |
| Mobile home | 119 |
| Boat, RV, van, etc. | 0 |
| Total housing units | 1,125 |
| Built 2014 or later | 0 |
| Built 2010 to 2013 | 0 |
| Built 2000 to 2009 | 85 |
| Built 1990 to 1999 | 88 |
| Built 1980 to 1989 | 72 |
| Built 1970 to 1979 | 141 |
| Built 1960 to 1969 | 162 |
| Built 1950 to 1959 | 215 |
| Built 1940 to 1949 | 215 |
| Built 1939 or earlier | 147 |
| Total housing units | 1,125 |
| 1 room | 17 |
| 2 rooms | 66 |
| 3 rooms | 43 |
| 4 rooms | 277 |
| 5 rooms | 277 |
| 6 rooms | 230 |
| 7 rooms | 43 |
| 8 rooms | 80 |
| 9 rooms or more | 92 |
| Median rooms | 5.1 |
| Total housing units | 1,125 |
| No bedroom | 17 |
| 1 bedroom | 155 |
| 2 bedrooms | 294 |
| 3 bedrooms | 486 |
| 4 bedrooms | 158 |
| 5 or more bedrooms | 15 |
| Occupied housing units | 1,043 |
| Owner-occupied | 596 |
| Renter-occupied | 447 |
| Average household size of owner-occupied unit | 3.11 |
| Average household size of renter-occupied unit | 2.88 |
| Occupied housing units | 1,043 |
| Moved in 2017 or later | 82 |
| Moved in 2015 to 2016 | 154 |
| Moved in 2010 to 2014 | 310 |
| Moved in 2000 to 2009 | 230 |
| Moved in 1990 to 1999 | 172 |
| Moved in 1989 and earlier | 95 |
| Owner-occupied units | 596 |
| Less than $50,000 | 58 |
| $50,000 to $99,999 | 270 |
| $100,000 to $149,999 | 155 |
| $150,000 to $199,999 | 80 |
| $200,000 to $299,999 | 28 |
| $300,000 to $499,999 | 0 |
| $500,000 to $999,999 | 0 |
| $1,000,000 or more | 5 |
| Median (dollars) | 94,400 |
| Owner-occupied units | 596 |
| Housing units with a mortgage | 384 |
| Housing units without a mortgage | 212 |
| Occupied units paying rent | 392 |
| Less than $500 | 67 |
| $500 to $999 | 286 |
| $1,000 to $1,499 | 39 |
| $1,500 to $1,999 | 0 |
| $2,000 to $2,499 | 0 |
| $2,500 to $2,999 | 0 |
| $3,000 or more | 0 |
| Median (dollars) | 646 |
| No rent paid | 55 |
Data is based on 2018 Census
ZIP Codes for other locations
State for NYSSA
Oregon ZIP CodesOther cities in Oregon