DANVILLE, PA ZIP Code
| City | DANVILLE |
| State | Pennsylvania |
| ZIP Codes count | 2 (see all) |
| Post offices count | 1 (see all) |
| Total population | 4,646 (see all) |
ZIP Codes in DANVILLE, Pennsylvania
17821, 17822
This list contains only 5-digit ZIP codes. Use our zip code lookup by address feature to get the full 9-digit (ZIP+4) code.
List of DANVILLE, PA ZIP Codes
| ZIP | TYPE | POPU |
|---|---|---|
| 17821 | STANDARD | 18,818 |
| 17822 | UNIQUE | 17 |
Post offices
DANVILLE — Post Office™ 410 MILL ST DANVILLE, PA 17821-9998 |
Envelope example
On the bottom center of the envelope, write the address you want your letter delivered to. Include the following on separate lines:
- Recipient's full name
- Full street address
- City, State, and ZIP Code
Using the same format, write the return address in the top left corner.
Using the full ZIP+4 Code when mailing via the USPS ensures the fastest, most accurate mailing possible. If you are not sure of the full 9-digit ZIP Code, use the 5-digit ZIP Code to avoid loss of letter or package.
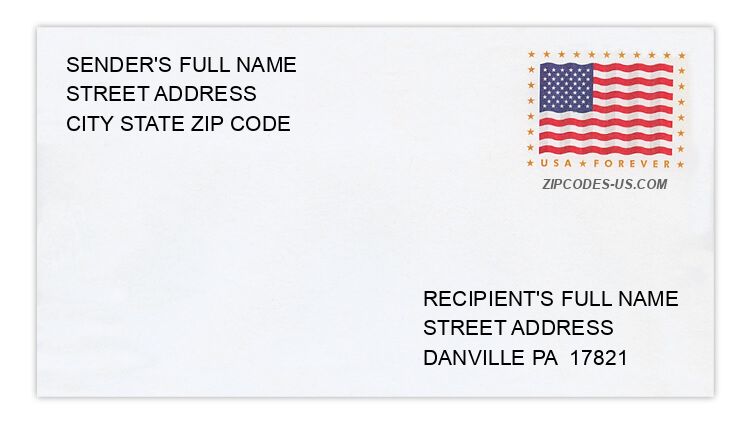
The recipient address information is provided for your reference.
Address example
78 CLARKS DR
DANVILLE PA 17821-9057
DANVILLE PA 17821-9057
60 DELONG RD
DANVILLE PA 17821-8915
DANVILLE PA 17821-8915
59 LEXI DR
DANVILLE PA 17821-6549
DANVILLE PA 17821-6549
20 PRIMROSE CT
DANVILLE PA 17821-8457
DANVILLE PA 17821-8457
91 ROSEWOOD CT
DANVILLE PA 17821-8594
DANVILLE PA 17821-8594
13 STRAWBERRY LN
DANVILLE PA 17821-9171
DANVILLE PA 17821-9171
Map
Hover over the map to see the ZIP code
Census data for DANVILLE, PA
Demographic and housing estimates in DANVILLE, PA
| Total population | 4,646 |
| Male | 2,111 |
| Female | 2,535 |
| Total population | 4,646 |
| Under 5 years | 192 |
| 5 to 9 years | 210 |
| 10 to 14 years | 249 |
| 15 to 19 years | 242 |
| 20 to 24 years | 293 |
| 25 to 34 years | 964 |
| 35 to 44 years | 575 |
| 45 to 54 years | 380 |
| 55 to 59 years | 278 |
| 60 to 64 years | 429 |
| 65 to 74 years | 423 |
| 75 to 84 years | 335 |
| 85 years and over | 76 |
| Median age (years) | 38.0 |
| Under 18 years | 779 |
| 16 years and over | 3,915 |
| 18 years and over | 3,867 |
| 21 years and over | 3,666 |
| 62 years and over | 1,060 |
| 65 years and over | 834 |
| Total population | 4,646 |
| One race | 4,582 |
| White | 4,215 |
| Black or African American | 57 |
| American Indian and Alaska Native | 0 |
| Asian | 310 |
| Native Hawaiian and Other Pacific Islander | 0 |
| Some other race | 0 |
| Two or more races | 64 |
| Citizen, VOTING AGE 18 and over population | 3,716 |
| Male Citizen, VOTING AGE 18 and over population | 1,633 |
| Female Citizen, VOTING AGE 18 and over population | 2,083 |
Social characteristics in DANVILLE, PA
| Total households | 2,356 |
| Family households (families) | 979 |
| Married-couple family | 471 |
| Male householder, no wife present, family | 132 |
| Female householder, no husband present, family | 376 |
| Nonfamily households | 1,377 |
| Average household size | 1.92 |
| Average family size | 2.88 |
Economic characteristics in DANVILLE, PA
| Total households | 2,356 |
| Less than $10,000 | 212 |
| $10,000 to $14,999 | 141 |
| $15,000 to $24,999 | 598 |
| $25,000 to $34,999 | 244 |
| $35,000 to $49,999 | 398 |
| $50,000 to $74,999 | 292 |
| $75,000 to $99,999 | 177 |
| $100,000 to $149,999 | 221 |
| $150,000 to $199,999 | 24 |
| $200,000 or more | 49 |
| Median household income (dollars) | 34,410 |
Housing characteristics in DANVILLE, PA
| Total housing units | 2,548 |
| Occupied housing units | 2,356 |
| Vacant housing units | 192 |
| Total housing units | 2,548 |
| 1-unit, detached | 951 |
| 1-unit, attached | 667 |
| 2 units | 302 |
| 3 or 4 units | 272 |
| 5 to 9 units | 27 |
| 10 to 19 units | 165 |
| 20 or more units | 66 |
| Mobile home | 98 |
| Boat, RV, van, etc. | 0 |
| Total housing units | 2,548 |
| Built 2014 or later | 0 |
| Built 2010 to 2013 | 54 |
| Built 2000 to 2009 | 45 |
| Built 1990 to 1999 | 117 |
| Built 1980 to 1989 | 414 |
| Built 1970 to 1979 | 179 |
| Built 1960 to 1969 | 257 |
| Built 1950 to 1959 | 161 |
| Built 1940 to 1949 | 269 |
| Built 1939 or earlier | 1,052 |
| Total housing units | 2,548 |
| 1 room | 139 |
| 2 rooms | 59 |
| 3 rooms | 376 |
| 4 rooms | 387 |
| 5 rooms | 602 |
| 6 rooms | 386 |
| 7 rooms | 279 |
| 8 rooms | 202 |
| 9 rooms or more | 118 |
| Median rooms | 5.0 |
| Total housing units | 2,548 |
| No bedroom | 152 |
| 1 bedroom | 514 |
| 2 bedrooms | 811 |
| 3 bedrooms | 894 |
| 4 bedrooms | 127 |
| 5 or more bedrooms | 50 |
| Occupied housing units | 2,356 |
| Owner-occupied | 927 |
| Renter-occupied | 1,429 |
| Average household size of owner-occupied unit | 2.13 |
| Average household size of renter-occupied unit | 1.78 |
| Occupied housing units | 2,356 |
| Moved in 2017 or later | 190 |
| Moved in 2015 to 2016 | 426 |
| Moved in 2010 to 2014 | 758 |
| Moved in 2000 to 2009 | 442 |
| Moved in 1990 to 1999 | 267 |
| Moved in 1989 and earlier | 273 |
| Owner-occupied units | 927 |
| Less than $50,000 | 163 |
| $50,000 to $99,999 | 241 |
| $100,000 to $149,999 | 190 |
| $150,000 to $199,999 | 204 |
| $200,000 to $299,999 | 113 |
| $300,000 to $499,999 | 16 |
| $500,000 to $999,999 | 0 |
| $1,000,000 or more | 0 |
| Median (dollars) | 115,300 |
| Owner-occupied units | 927 |
| Housing units with a mortgage | 410 |
| Housing units without a mortgage | 517 |
| Occupied units paying rent | 1,334 |
| Less than $500 | 281 |
| $500 to $999 | 731 |
| $1,000 to $1,499 | 302 |
| $1,500 to $1,999 | 20 |
| $2,000 to $2,499 | 0 |
| $2,500 to $2,999 | 0 |
| $3,000 or more | 0 |
| Median (dollars) | 703 |
| No rent paid | 95 |
Data is based on 2018 Census
ZIP Codes for other locations
State for DANVILLE
Pennsylvania ZIP CodesOther cities in Pennsylvania