BLUFFTON, SC ZIP Code
| City | BLUFFTON |
| State | South Carolina |
| ZIP Codes count | 2 (see all) |
| Post offices count | 1 (see all) |
| Total population | 18,835 (see all) |
ZIP Codes in BLUFFTON, South Carolina
29909, 29910
This list contains only 5-digit ZIP codes. Use our zip code lookup by address feature to get the full 9-digit (ZIP+4) code.
List of BLUFFTON, SC ZIP Codes
| ZIP | TYPE | POPU |
|---|---|---|
| 29909 | STANDARD | 21,794 |
| 29910 | STANDARD | 46,606 |
Post offices
BLUFFTON — Post Office™ 25 THURMOND WAY BLUFFTON, SC 29910-9998 |
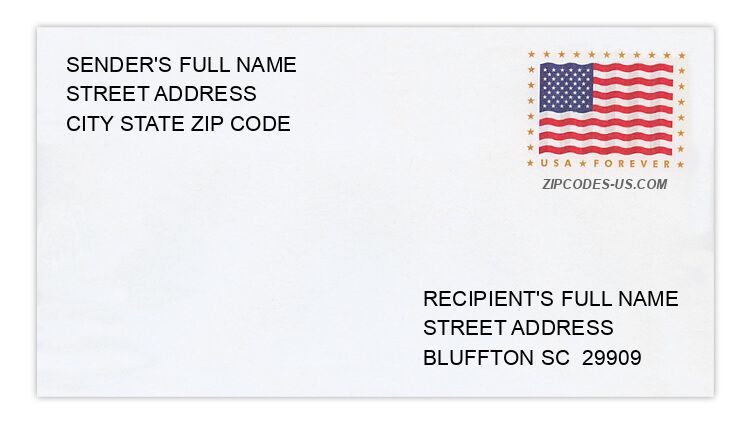
Envelope example
On the bottom center of the envelope, write the address you want your letter delivered to. Include the following on separate lines:
- Recipient's full name
- Full street address
- City, State, and ZIP Code
Using the same format, write the return address in the top left corner.
Using the full ZIP+4 Code when mailing via the USPS ensures the fastest, most accurate mailing possible. If you are not sure of the full 9-digit ZIP Code, use the 5-digit ZIP Code to avoid loss of letter or package.
The recipient address information is provided for your reference.
Address example
34 BARRY LN
BLUFFTON SC 29910-4889
BLUFFTON SC 29910-4889
50 BISHOP ST
BLUFFTON SC 29909-6145
BLUFFTON SC 29909-6145
124 HOLLY RIDGE DR
BLUFFTON SC 29910-7970
BLUFFTON SC 29910-7970
74 KINGS CREEK DR
BLUFFTON SC 29909-5122
BLUFFTON SC 29909-5122
102 RED NORTHERN OAK WAY
BLUFFTON SC 29910-4543
BLUFFTON SC 29910-4543
71 SEBURN DR
BLUFFTON SC 29909-5036
BLUFFTON SC 29909-5036
Map
Hover over the map to see the ZIP code
Census data for BLUFFTON, SC
Demographic and housing estimates in BLUFFTON, SC
| Total population | 18,835 |
| Male | 9,336 |
| Female | 9,499 |
| Total population | 18,835 |
| Under 5 years | 1,072 |
| 5 to 9 years | 1,324 |
| 10 to 14 years | 1,529 |
| 15 to 19 years | 1,157 |
| 20 to 24 years | 1,295 |
| 25 to 34 years | 2,458 |
| 35 to 44 years | 2,990 |
| 45 to 54 years | 2,299 |
| 55 to 59 years | 822 |
| 60 to 64 years | 972 |
| 65 to 74 years | 2,270 |
| 75 to 84 years | 521 |
| 85 years and over | 126 |
| Median age (years) | 37.0 |
| Under 18 years | 4,716 |
| 16 years and over | 14,656 |
| 18 years and over | 14,119 |
| 21 years and over | 13,438 |
| 62 years and over | 3,575 |
| 65 years and over | 2,917 |
| Total population | 18,835 |
| One race | 18,316 |
| White | 15,236 |
| Black or African American | 1,464 |
| American Indian and Alaska Native | 69 |
| Asian | 508 |
| Native Hawaiian and Other Pacific Islander | 11 |
| Some other race | 1,028 |
| Two or more races | 519 |
| Citizen, VOTING AGE 18 and over population | 12,860 |
| Male Citizen, VOTING AGE 18 and over population | 6,274 |
| Female Citizen, VOTING AGE 18 and over population | 6,586 |
Social characteristics in BLUFFTON, SC
| Total households | 6,790 |
| Family households (families) | 4,975 |
| Married-couple family | 4,122 |
| Male householder, no wife present, family | 142 |
| Female householder, no husband present, family | 711 |
| Nonfamily households | 1,815 |
| Average household size | 2.77 |
| Average family size | 3.25 |
Economic characteristics in BLUFFTON, SC
| Total households | 6,790 |
| Less than $10,000 | 142 |
| $10,000 to $14,999 | 52 |
| $15,000 to $24,999 | 209 |
| $25,000 to $34,999 | 640 |
| $35,000 to $49,999 | 770 |
| $50,000 to $74,999 | 1,606 |
| $75,000 to $99,999 | 1,098 |
| $100,000 to $149,999 | 1,201 |
| $150,000 to $199,999 | 643 |
| $200,000 or more | 429 |
| Median household income (dollars) | 74,695 |
Housing characteristics in BLUFFTON, SC
| Total housing units | 7,651 |
| Occupied housing units | 6,790 |
| Vacant housing units | 861 |
| Total housing units | 7,651 |
| 1-unit, detached | 5,827 |
| 1-unit, attached | 1,196 |
| 2 units | 78 |
| 3 or 4 units | 142 |
| 5 to 9 units | 83 |
| 10 to 19 units | 132 |
| 20 or more units | 82 |
| Mobile home | 111 |
| Boat, RV, van, etc. | 0 |
| Total housing units | 7,651 |
| Built 2014 or later | 928 |
| Built 2010 to 2013 | 1,042 |
| Built 2000 to 2009 | 4,936 |
| Built 1990 to 1999 | 390 |
| Built 1980 to 1989 | 213 |
| Built 1970 to 1979 | 60 |
| Built 1960 to 1969 | 44 |
| Built 1950 to 1959 | 6 |
| Built 1940 to 1949 | 0 |
| Built 1939 or earlier | 32 |
| Total housing units | 7,651 |
| 1 room | 80 |
| 2 rooms | 46 |
| 3 rooms | 220 |
| 4 rooms | 626 |
| 5 rooms | 1,137 |
| 6 rooms | 1,878 |
| 7 rooms | 1,317 |
| 8 rooms | 1,290 |
| 9 rooms or more | 1,057 |
| Median rooms | 6.4 |
| Total housing units | 7,651 |
| No bedroom | 80 |
| 1 bedroom | 154 |
| 2 bedrooms | 939 |
| 3 bedrooms | 3,946 |
| 4 bedrooms | 2,313 |
| 5 or more bedrooms | 219 |
| Occupied housing units | 6,790 |
| Owner-occupied | 5,338 |
| Renter-occupied | 1,452 |
| Average household size of owner-occupied unit | 2.70 |
| Average household size of renter-occupied unit | 3.01 |
| Occupied housing units | 6,790 |
| Moved in 2017 or later | 479 |
| Moved in 2015 to 2016 | 1,266 |
| Moved in 2010 to 2014 | 2,652 |
| Moved in 2000 to 2009 | 2,231 |
| Moved in 1990 to 1999 | 76 |
| Moved in 1989 and earlier | 86 |
| Owner-occupied units | 5,338 |
| Less than $50,000 | 34 |
| $50,000 to $99,999 | 72 |
| $100,000 to $149,999 | 507 |
| $150,000 to $199,999 | 896 |
| $200,000 to $299,999 | 1,670 |
| $300,000 to $499,999 | 1,312 |
| $500,000 to $999,999 | 719 |
| $1,000,000 or more | 128 |
| Median (dollars) | 266,200 |
| Owner-occupied units | 5,338 |
| Housing units with a mortgage | 3,944 |
| Housing units without a mortgage | 1,394 |
| Occupied units paying rent | 1,366 |
| Less than $500 | 0 |
| $500 to $999 | 27 |
| $1,000 to $1,499 | 589 |
| $1,500 to $1,999 | 473 |
| $2,000 to $2,499 | 172 |
| $2,500 to $2,999 | 57 |
| $3,000 or more | 48 |
| Median (dollars) | 1,571 |
| No rent paid | 86 |
Data is based on 2018 Census
ZIP Codes for other locations
State for BLUFFTON
South Carolina ZIP CodesOther cities in South Carolina