CAYCE, SC ZIP Code
| City | CAYCE |
| State | South Carolina |
| ZIP Codes count | 3 (see all) |
| Post offices count | 1 (see all) |
| Total population | 13,621 (see all) |
ZIP Codes in CAYCE, South Carolina
29033, 29171, 29172
This list contains only 5-digit ZIP codes. Use our zip code lookup by address feature to get the full 9-digit (ZIP+4) code.
List of CAYCE, SC ZIP Codes
| ZIP | TYPE | POPU |
|---|---|---|
| 29033 | STANDARD | 12,789 |
| 29171 | PO BOX | – |
| 29172 | STANDARD | 9,290 |
Post offices
CAYCE WEST COLUMBIA — Post Office™ 1535 PLATT SPRINGS RD WEST COLUMBIA, SC 29169-9998 |
Envelope example
On the bottom center of the envelope, write the address you want your letter delivered to. Include the following on separate lines:
- Recipient's full name
- Full street address
- City, State, and ZIP Code
Using the same format, write the return address in the top left corner.
Using the full ZIP+4 Code when mailing via the USPS ensures the fastest, most accurate mailing possible. If you are not sure of the full 9-digit ZIP Code, use the 5-digit ZIP Code to avoid loss of letter or package.
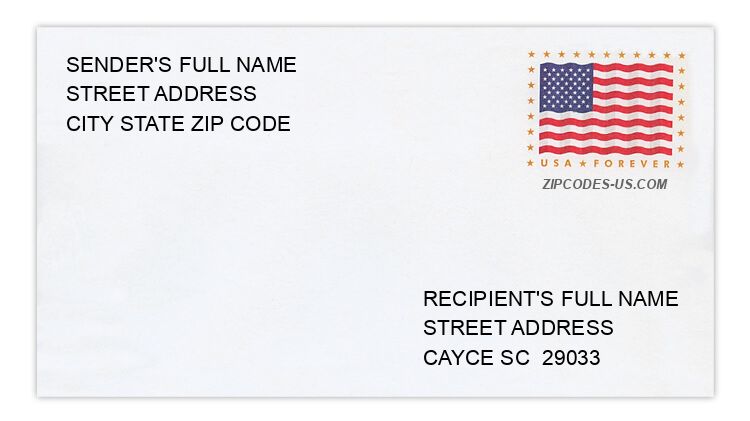
The recipient address information is provided for your reference.
Address example
1460 ALEX ST
CAYCE SC 29033-2608
CAYCE SC 29033-2608
2421 BREEZEWOOD RD
CAYCE SC 29033-2168
CAYCE SC 29033-2168
126 BRICKWORKS DR
CAYCE SC 29033-4429
CAYCE SC 29033-4429
356 MOSS CREEK CT
CAYCE SC 29033-1990
CAYCE SC 29033-1990
838 OAKLAND AVE
CAYCE SC 29033-3612
CAYCE SC 29033-3612
251 SHADY LN
CAYCE SC 29033-2721
CAYCE SC 29033-2721
Map
Hover over the map to see the ZIP code
Census data for CAYCE, SC
Demographic and housing estimates in CAYCE, SC
| Total population | 13,621 |
| Male | 6,771 |
| Female | 6,850 |
| Total population | 13,621 |
| Under 5 years | 740 |
| 5 to 9 years | 720 |
| 10 to 14 years | 659 |
| 15 to 19 years | 806 |
| 20 to 24 years | 1,728 |
| 25 to 34 years | 2,716 |
| 35 to 44 years | 1,174 |
| 45 to 54 years | 1,627 |
| 55 to 59 years | 577 |
| 60 to 64 years | 978 |
| 65 to 74 years | 1,056 |
| 75 to 84 years | 580 |
| 85 years and over | 260 |
| Median age (years) | 31.7 |
| Under 18 years | 2,478 |
| 16 years and over | 11,373 |
| 18 years and over | 11,143 |
| 21 years and over | 10,407 |
| 62 years and over | 2,349 |
| 65 years and over | 1,896 |
| Total population | 13,621 |
| One race | 13,320 |
| White | 9,588 |
| Black or African American | 2,935 |
| American Indian and Alaska Native | 57 |
| Asian | 587 |
| Native Hawaiian and Other Pacific Islander | 47 |
| Some other race | 106 |
| Two or more races | 301 |
| Citizen, VOTING AGE 18 and over population | 10,834 |
| Male Citizen, VOTING AGE 18 and over population | 5,304 |
| Female Citizen, VOTING AGE 18 and over population | 5,530 |
Social characteristics in CAYCE, SC
| Total households | 5,905 |
| Family households (families) | 2,848 |
| Married-couple family | 1,879 |
| Male householder, no wife present, family | 225 |
| Female householder, no husband present, family | 744 |
| Nonfamily households | 3,057 |
| Average household size | 2.31 |
| Average family size | 2.98 |
Economic characteristics in CAYCE, SC
| Total households | 5,905 |
| Less than $10,000 | 315 |
| $10,000 to $14,999 | 317 |
| $15,000 to $24,999 | 738 |
| $25,000 to $34,999 | 569 |
| $35,000 to $49,999 | 959 |
| $50,000 to $74,999 | 1,239 |
| $75,000 to $99,999 | 882 |
| $100,000 to $149,999 | 601 |
| $150,000 to $199,999 | 151 |
| $200,000 or more | 134 |
| Median household income (dollars) | 50,545 |
Housing characteristics in CAYCE, SC
| Total housing units | 6,317 |
| Occupied housing units | 5,905 |
| Vacant housing units | 412 |
| Total housing units | 6,317 |
| 1-unit, detached | 4,572 |
| 1-unit, attached | 144 |
| 2 units | 318 |
| 3 or 4 units | 243 |
| 5 to 9 units | 296 |
| 10 to 19 units | 291 |
| 20 or more units | 300 |
| Mobile home | 153 |
| Boat, RV, van, etc. | 0 |
| Total housing units | 6,317 |
| Built 2014 or later | 239 |
| Built 2010 to 2013 | 209 |
| Built 2000 to 2009 | 590 |
| Built 1990 to 1999 | 628 |
| Built 1980 to 1989 | 511 |
| Built 1970 to 1979 | 851 |
| Built 1960 to 1969 | 1,456 |
| Built 1950 to 1959 | 1,315 |
| Built 1940 to 1949 | 413 |
| Built 1939 or earlier | 105 |
| Total housing units | 6,317 |
| 1 room | 122 |
| 2 rooms | 45 |
| 3 rooms | 572 |
| 4 rooms | 844 |
| 5 rooms | 1,529 |
| 6 rooms | 1,781 |
| 7 rooms | 688 |
| 8 rooms | 339 |
| 9 rooms or more | 397 |
| Median rooms | 5.5 |
| Total housing units | 6,317 |
| No bedroom | 122 |
| 1 bedroom | 502 |
| 2 bedrooms | 1,427 |
| 3 bedrooms | 3,301 |
| 4 bedrooms | 816 |
| 5 or more bedrooms | 149 |
| Occupied housing units | 5,905 |
| Owner-occupied | 3,405 |
| Renter-occupied | 2,500 |
| Average household size of owner-occupied unit | 2.31 |
| Average household size of renter-occupied unit | 2.31 |
| Occupied housing units | 5,905 |
| Moved in 2017 or later | 453 |
| Moved in 2015 to 2016 | 722 |
| Moved in 2010 to 2014 | 1,741 |
| Moved in 2000 to 2009 | 1,237 |
| Moved in 1990 to 1999 | 693 |
| Moved in 1989 and earlier | 1,059 |
| Owner-occupied units | 3,405 |
| Less than $50,000 | 252 |
| $50,000 to $99,999 | 857 |
| $100,000 to $149,999 | 1,174 |
| $150,000 to $199,999 | 715 |
| $200,000 to $299,999 | 317 |
| $300,000 to $499,999 | 74 |
| $500,000 to $999,999 | 0 |
| $1,000,000 or more | 16 |
| Median (dollars) | 127,400 |
| Owner-occupied units | 3,405 |
| Housing units with a mortgage | 2,224 |
| Housing units without a mortgage | 1,181 |
| Occupied units paying rent | 2,371 |
| Less than $500 | 172 |
| $500 to $999 | 1,177 |
| $1,000 to $1,499 | 832 |
| $1,500 to $1,999 | 71 |
| $2,000 to $2,499 | 102 |
| $2,500 to $2,999 | 17 |
| $3,000 or more | 0 |
| Median (dollars) | 923 |
| No rent paid | 129 |
Data is based on 2018 Census
ZIP Codes for other locations
State for CAYCE
South Carolina ZIP CodesOther cities in South Carolina