MURRELLS INLET, SC ZIP Code
| City | MURRELLS INLET |
| State | South Carolina |
| ZIP Codes count | 1 (see all) |
| Post offices count | 1 (see all) |
| Total population | 9,396 (see all) |
ZIP Code in MURRELLS INLET, South Carolina
29576
This list contains only 5-digit ZIP codes. Use our zip code lookup by address feature to get the full 9-digit (ZIP+4) code.
List of MURRELLS INLET, SC ZIP Codes
| ZIP | TYPE | POPU |
|---|---|---|
| 29576 | STANDARD | 32,394 |
Post offices
MURRELLS INLET — Post Office™ 654 BELLAMY AVE MURRELLS INLET, SC 29576-9998 |
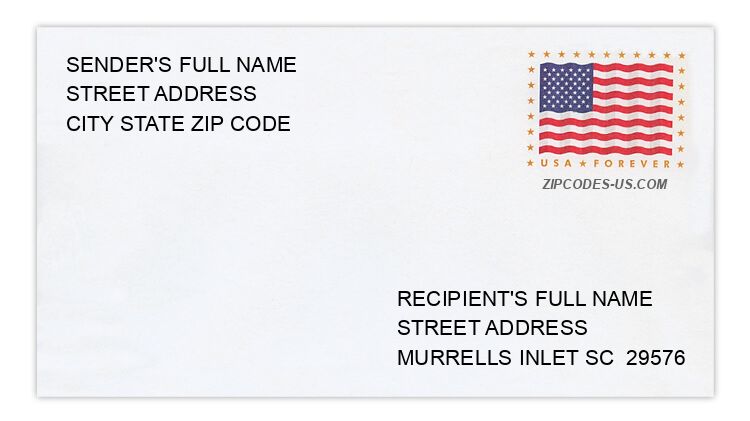
Envelope example
On the bottom center of the envelope, write the address you want your letter delivered to. Include the following on separate lines:
- Recipient's full name
- Full street address
- City, State, and ZIP Code
Using the same format, write the return address in the top left corner.
Using the full ZIP+4 Code when mailing via the USPS ensures the fastest, most accurate mailing possible. If you are not sure of the full 9-digit ZIP Code, use the 5-digit ZIP Code to avoid loss of letter or package.
The recipient address information is provided for your reference.
Address example
3018 ATLANTA CIR
MURRELLS INLET SC 29576-8216
MURRELLS INLET SC 29576-8216
9468 CHICORY LN
MURRELLS INLET SC 29576-8601
MURRELLS INLET SC 29576-8601
9653 KINGS GRANT DR
MURRELLS INLET SC 29576-8319
MURRELLS INLET SC 29576-8319
387 MCFARLAN CIR
MURRELLS INLET SC 29576-8188
MURRELLS INLET SC 29576-8188
374 MORSE AVE
MURRELLS INLET SC 29576-5206
MURRELLS INLET SC 29576-5206
8027 TAG CT
MURRELLS INLET SC 29576-8378
MURRELLS INLET SC 29576-8378
Map
Hover over the map to see the ZIP code
Census data for MURRELLS INLET, SC
Demographic and housing estimates in MURRELLS INLET, SC
| Total population | 9,396 |
| Male | 4,599 |
| Female | 4,797 |
| Total population | 9,396 |
| Under 5 years | 295 |
| 5 to 9 years | 323 |
| 10 to 14 years | 453 |
| 15 to 19 years | 265 |
| 20 to 24 years | 309 |
| 25 to 34 years | 628 |
| 35 to 44 years | 862 |
| 45 to 54 years | 1,369 |
| 55 to 59 years | 961 |
| 60 to 64 years | 944 |
| 65 to 74 years | 1,974 |
| 75 to 84 years | 777 |
| 85 years and over | 236 |
| Median age (years) | 55.8 |
| Under 18 years | 1,278 |
| 16 years and over | 8,290 |
| 18 years and over | 8,118 |
| 21 years and over | 8,044 |
| 62 years and over | 3,513 |
| 65 years and over | 2,987 |
| Total population | 9,396 |
| One race | 9,303 |
| White | 8,081 |
| Black or African American | 1,081 |
| American Indian and Alaska Native | 0 |
| Asian | 107 |
| Native Hawaiian and Other Pacific Islander | 0 |
| Some other race | 34 |
| Two or more races | 93 |
| Citizen, VOTING AGE 18 and over population | 8,084 |
| Male Citizen, VOTING AGE 18 and over population | 3,665 |
| Female Citizen, VOTING AGE 18 and over population | 4,419 |
Social characteristics in MURRELLS INLET, SC
| Total households | 4,084 |
| Family households (families) | 2,819 |
| Married-couple family | 2,234 |
| Male householder, no wife present, family | 82 |
| Female householder, no husband present, family | 503 |
| Nonfamily households | 1,265 |
| Average household size | 2.30 |
| Average family size | 2.76 |
Economic characteristics in MURRELLS INLET, SC
| Total households | 4,084 |
| Less than $10,000 | 131 |
| $10,000 to $14,999 | 169 |
| $15,000 to $24,999 | 489 |
| $25,000 to $34,999 | 393 |
| $35,000 to $49,999 | 670 |
| $50,000 to $74,999 | 695 |
| $75,000 to $99,999 | 659 |
| $100,000 to $149,999 | 480 |
| $150,000 to $199,999 | 166 |
| $200,000 or more | 232 |
| Median household income (dollars) | 55,735 |
Housing characteristics in MURRELLS INLET, SC
| Total housing units | 5,295 |
| Occupied housing units | 4,084 |
| Vacant housing units | 1,211 |
| Total housing units | 5,295 |
| 1-unit, detached | 2,909 |
| 1-unit, attached | 418 |
| 2 units | 76 |
| 3 or 4 units | 78 |
| 5 to 9 units | 714 |
| 10 to 19 units | 47 |
| 20 or more units | 45 |
| Mobile home | 1,008 |
| Boat, RV, van, etc. | 0 |
| Total housing units | 5,295 |
| Built 2014 or later | 295 |
| Built 2010 to 2013 | 230 |
| Built 2000 to 2009 | 1,580 |
| Built 1990 to 1999 | 1,646 |
| Built 1980 to 1989 | 894 |
| Built 1970 to 1979 | 353 |
| Built 1960 to 1969 | 100 |
| Built 1950 to 1959 | 132 |
| Built 1940 to 1949 | 48 |
| Built 1939 or earlier | 17 |
| Total housing units | 5,295 |
| 1 room | 0 |
| 2 rooms | 45 |
| 3 rooms | 107 |
| 4 rooms | 970 |
| 5 rooms | 1,153 |
| 6 rooms | 1,060 |
| 7 rooms | 739 |
| 8 rooms | 587 |
| 9 rooms or more | 634 |
| Median rooms | 5.9 |
| Total housing units | 5,295 |
| No bedroom | 0 |
| 1 bedroom | 96 |
| 2 bedrooms | 1,268 |
| 3 bedrooms | 2,636 |
| 4 bedrooms | 1,051 |
| 5 or more bedrooms | 244 |
| Occupied housing units | 4,084 |
| Owner-occupied | 3,339 |
| Renter-occupied | 745 |
| Average household size of owner-occupied unit | 2.34 |
| Average household size of renter-occupied unit | 2.12 |
| Occupied housing units | 4,084 |
| Moved in 2017 or later | 297 |
| Moved in 2015 to 2016 | 681 |
| Moved in 2010 to 2014 | 1,199 |
| Moved in 2000 to 2009 | 1,121 |
| Moved in 1990 to 1999 | 520 |
| Moved in 1989 and earlier | 266 |
| Owner-occupied units | 3,339 |
| Less than $50,000 | 309 |
| $50,000 to $99,999 | 474 |
| $100,000 to $149,999 | 373 |
| $150,000 to $199,999 | 233 |
| $200,000 to $299,999 | 626 |
| $300,000 to $499,999 | 822 |
| $500,000 to $999,999 | 441 |
| $1,000,000 or more | 61 |
| Median (dollars) | 250,600 |
| Owner-occupied units | 3,339 |
| Housing units with a mortgage | 1,931 |
| Housing units without a mortgage | 1,408 |
| Occupied units paying rent | 727 |
| Less than $500 | 48 |
| $500 to $999 | 183 |
| $1,000 to $1,499 | 386 |
| $1,500 to $1,999 | 63 |
| $2,000 to $2,499 | 18 |
| $2,500 to $2,999 | 29 |
| $3,000 or more | 0 |
| Median (dollars) | 1,143 |
| No rent paid | 18 |
Data is based on 2018 Census
ZIP Codes for other locations
State for MURRELLS INLET
South Carolina ZIP CodesOther cities in South Carolina