TAYLORS, SC ZIP Code
| City | TAYLORS |
| State | South Carolina |
| ZIP Codes count | 1 (see all) |
| Post offices count | 1 (see all) |
| Total population | 21,923 (see all) |
ZIP Code in TAYLORS, South Carolina
29687
This list contains only 5-digit ZIP codes. Use our zip code lookup by address feature to get the full 9-digit (ZIP+4) code.
List of TAYLORS, SC ZIP Codes
| ZIP | TYPE | POPU |
|---|---|---|
| 29687 | STANDARD | 41,861 |
Post offices
TAYLORS — Post Office™ 4359 WADE HAMPTON BLVD TAYLORS, SC 29687-9998 |
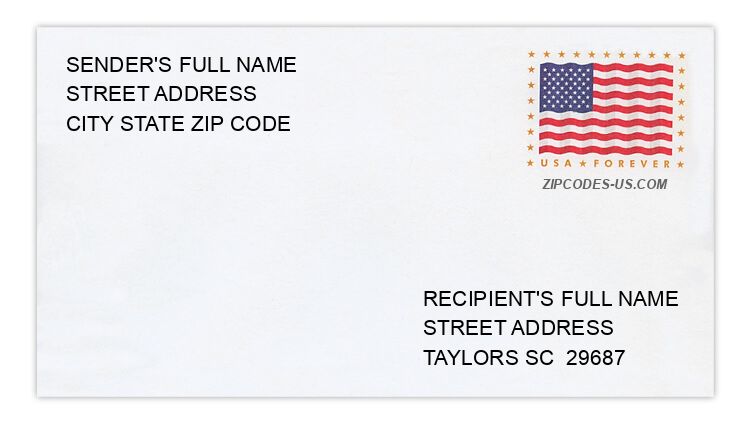
Envelope example
On the bottom center of the envelope, write the address you want your letter delivered to. Include the following on separate lines:
- Recipient's full name
- Full street address
- City, State, and ZIP Code
Using the same format, write the return address in the top left corner.
Using the full ZIP+4 Code when mailing via the USPS ensures the fastest, most accurate mailing possible. If you are not sure of the full 9-digit ZIP Code, use the 5-digit ZIP Code to avoid loss of letter or package.
The recipient address information is provided for your reference.
Address example
12 BLUFFTON CIR
TAYLORS SC 29687-4325
TAYLORS SC 29687-4325
35 BROOKE LEE CIR
TAYLORS SC 29687-5970
TAYLORS SC 29687-5970
43 E WOODBURN DR
TAYLORS SC 29687-5130
TAYLORS SC 29687-5130
45 LINE ST
TAYLORS SC 29687-2436
TAYLORS SC 29687-2436
55 PINE VIEW TER
TAYLORS SC 29687-6637
TAYLORS SC 29687-6637
634 S PACKS MOUNTAIN RD
TAYLORS SC 29687-7137
TAYLORS SC 29687-7137
Map
Hover over the map to see the ZIP code
Census data for TAYLORS, SC
Demographic and housing estimates in TAYLORS, SC
| Total population | 21,923 |
| Male | 10,722 |
| Female | 11,201 |
| Total population | 21,923 |
| Under 5 years | 1,448 |
| 5 to 9 years | 1,199 |
| 10 to 14 years | 1,301 |
| 15 to 19 years | 1,116 |
| 20 to 24 years | 1,283 |
| 25 to 34 years | 3,437 |
| 35 to 44 years | 2,681 |
| 45 to 54 years | 3,139 |
| 55 to 59 years | 1,307 |
| 60 to 64 years | 1,297 |
| 65 to 74 years | 2,092 |
| 75 to 84 years | 1,239 |
| 85 years and over | 384 |
| Median age (years) | 38.8 |
| Under 18 years | 4,634 |
| 16 years and over | 17,707 |
| 18 years and over | 17,289 |
| 21 years and over | 16,607 |
| 62 years and over | 4,431 |
| 65 years and over | 3,715 |
| Total population | 21,923 |
| One race | 21,445 |
| White | 17,081 |
| Black or African American | 3,436 |
| American Indian and Alaska Native | 69 |
| Asian | 489 |
| Native Hawaiian and Other Pacific Islander | 17 |
| Some other race | 353 |
| Two or more races | 478 |
| Citizen, VOTING AGE 18 and over population | 16,505 |
| Male Citizen, VOTING AGE 18 and over population | 7,881 |
| Female Citizen, VOTING AGE 18 and over population | 8,624 |
Social characteristics in TAYLORS, SC
| Total households | 8,543 |
| Family households (families) | 5,798 |
| Married-couple family | 4,176 |
| Male householder, no wife present, family | 465 |
| Female householder, no husband present, family | 1,157 |
| Nonfamily households | 2,745 |
| Average household size | 2.57 |
| Average family size | 3.09 |
Economic characteristics in TAYLORS, SC
| Total households | 8,543 |
| Less than $10,000 | 540 |
| $10,000 to $14,999 | 377 |
| $15,000 to $24,999 | 717 |
| $25,000 to $34,999 | 887 |
| $35,000 to $49,999 | 1,311 |
| $50,000 to $74,999 | 1,985 |
| $75,000 to $99,999 | 1,194 |
| $100,000 to $149,999 | 1,008 |
| $150,000 to $199,999 | 331 |
| $200,000 or more | 193 |
| Median household income (dollars) | 55,101 |
Housing characteristics in TAYLORS, SC
| Total housing units | 8,970 |
| Occupied housing units | 8,543 |
| Vacant housing units | 427 |
| Total housing units | 8,970 |
| 1-unit, detached | 6,553 |
| 1-unit, attached | 352 |
| 2 units | 230 |
| 3 or 4 units | 130 |
| 5 to 9 units | 278 |
| 10 to 19 units | 642 |
| 20 or more units | 483 |
| Mobile home | 302 |
| Boat, RV, van, etc. | 0 |
| Total housing units | 8,970 |
| Built 2014 or later | 49 |
| Built 2010 to 2013 | 171 |
| Built 2000 to 2009 | 849 |
| Built 1990 to 1999 | 968 |
| Built 1980 to 1989 | 2,287 |
| Built 1970 to 1979 | 2,213 |
| Built 1960 to 1969 | 1,526 |
| Built 1950 to 1959 | 424 |
| Built 1940 to 1949 | 378 |
| Built 1939 or earlier | 105 |
| Total housing units | 8,970 |
| 1 room | 114 |
| 2 rooms | 95 |
| 3 rooms | 221 |
| 4 rooms | 1,377 |
| 5 rooms | 1,763 |
| 6 rooms | 2,032 |
| 7 rooms | 1,338 |
| 8 rooms | 850 |
| 9 rooms or more | 1,180 |
| Median rooms | 6.0 |
| Total housing units | 8,970 |
| No bedroom | 114 |
| 1 bedroom | 336 |
| 2 bedrooms | 1,947 |
| 3 bedrooms | 4,889 |
| 4 bedrooms | 1,551 |
| 5 or more bedrooms | 133 |
| Occupied housing units | 8,543 |
| Owner-occupied | 6,058 |
| Renter-occupied | 2,485 |
| Average household size of owner-occupied unit | 2.59 |
| Average household size of renter-occupied unit | 2.50 |
| Occupied housing units | 8,543 |
| Moved in 2017 or later | 316 |
| Moved in 2015 to 2016 | 919 |
| Moved in 2010 to 2014 | 2,591 |
| Moved in 2000 to 2009 | 2,310 |
| Moved in 1990 to 1999 | 1,162 |
| Moved in 1989 and earlier | 1,245 |
| Owner-occupied units | 6,058 |
| Less than $50,000 | 202 |
| $50,000 to $99,999 | 709 |
| $100,000 to $149,999 | 1,877 |
| $150,000 to $199,999 | 2,037 |
| $200,000 to $299,999 | 1,001 |
| $300,000 to $499,999 | 187 |
| $500,000 to $999,999 | 27 |
| $1,000,000 or more | 18 |
| Median (dollars) | 155,300 |
| Owner-occupied units | 6,058 |
| Housing units with a mortgage | 4,024 |
| Housing units without a mortgage | 2,034 |
| Occupied units paying rent | 2,399 |
| Less than $500 | 57 |
| $500 to $999 | 1,662 |
| $1,000 to $1,499 | 559 |
| $1,500 to $1,999 | 101 |
| $2,000 to $2,499 | 20 |
| $2,500 to $2,999 | 0 |
| $3,000 or more | 0 |
| Median (dollars) | 839 |
| No rent paid | 86 |
Data is based on 2018 Census
ZIP Codes for other locations
State for TAYLORS
South Carolina ZIP CodesOther cities in South Carolina