WEST COLUMBIA, SC ZIP Code
| City | WEST COLUMBIA |
| State | South Carolina |
| ZIP Codes count | 5 (see all) |
| Post offices count | 1 (see all) |
| Total population | 17,296 (see all) |
ZIP Codes in WEST COLUMBIA, South Carolina
The ZIP Codes in WEST COLUMBIA, South Carolina fall within the range from 29033 to 29172. WEST COLUMBIA is covered by 5 ZIP Codes: 4 Standard and 1 PO Box. Below is the complete list:
29033, 29169, 29170, 29171, 29172
This list contains only 5-digit ZIP codes. Use our zip code lookup by address feature to get the full 9-digit (ZIP+4) code.
List of WEST COLUMBIA, SC ZIP Codes
| ZIP | TYPE | POPU |
|---|---|---|
| 29033 | STANDARD | 12,789 |
| 29169 | STANDARD | 21,690 |
| 29170 | STANDARD | 21,954 |
| 29171 | PO BOX | – |
| 29172 | STANDARD | 9,290 |
Post offices
CAYCE WEST COLUMBIA — Post Office™ 1535 PLATT SPRINGS RD WEST COLUMBIA, SC 29169-9998 |
Envelope example
On the bottom center of the envelope, write the address you want your letter delivered to. Include the following on separate lines:
- Recipient's full name
- Full street address
- City, State, and ZIP Code
Using the same format, write the return address in the top left corner.
Using the full ZIP+4 Code when mailing via the USPS ensures the fastest, most accurate mailing possible. If you are not sure of the full 9-digit ZIP Code, use the 5-digit ZIP Code to avoid loss of letter or package.
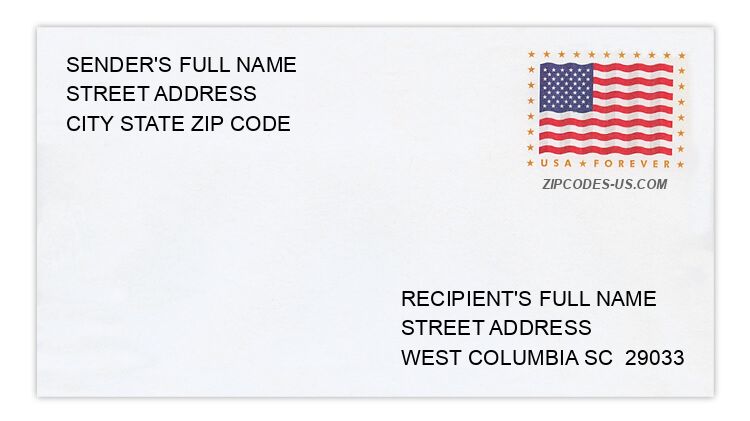
The recipient address information is provided for your reference.
Address example
127 CLOUDBURST CT
WEST COLUMBIA SC 29172-2018
WEST COLUMBIA SC 29172-2018
4255 DAVON DR
WEST COLUMBIA SC 29170-4111
WEST COLUMBIA SC 29170-4111
690 DIXIANA RD
WEST COLUMBIA SC 29172-3121
WEST COLUMBIA SC 29172-3121
1786 E BERRY RD
WEST COLUMBIA SC 29172-1766
WEST COLUMBIA SC 29172-1766
1748 ORIOLE LN
WEST COLUMBIA SC 29169-5428
WEST COLUMBIA SC 29169-5428
404 SWEETBIRCH DR
WEST COLUMBIA SC 29169-3464
WEST COLUMBIA SC 29169-3464
Map
Hover over the map to see the ZIP code
Census data for WEST COLUMBIA, SC
Demographic and housing estimates in WEST COLUMBIA, SC
| Total population | 17,296 |
| Male | 8,474 |
| Female | 8,822 |
| Total population | 17,296 |
| Under 5 years | 1,033 |
| 5 to 9 years | 754 |
| 10 to 14 years | 574 |
| 15 to 19 years | 713 |
| 20 to 24 years | 1,275 |
| 25 to 34 years | 3,194 |
| 35 to 44 years | 2,002 |
| 45 to 54 years | 1,894 |
| 55 to 59 years | 1,286 |
| 60 to 64 years | 1,136 |
| 65 to 74 years | 1,893 |
| 75 to 84 years | 888 |
| 85 years and over | 654 |
| Median age (years) | 39.9 |
| Under 18 years | 2,701 |
| 16 years and over | 14,850 |
| 18 years and over | 14,595 |
| 21 years and over | 14,025 |
| 62 years and over | 4,005 |
| 65 years and over | 3,435 |
| Total population | 17,296 |
| One race | 16,716 |
| White | 13,009 |
| Black or African American | 2,959 |
| American Indian and Alaska Native | 25 |
| Asian | 298 |
| Native Hawaiian and Other Pacific Islander | 38 |
| Some other race | 387 |
| Two or more races | 580 |
| Citizen, VOTING AGE 18 and over population | 13,183 |
| Male Citizen, VOTING AGE 18 and over population | 6,214 |
| Female Citizen, VOTING AGE 18 and over population | 6,969 |
Social characteristics in WEST COLUMBIA, SC
| Total households | 8,059 |
| Family households (families) | 3,657 |
| Married-couple family | 2,480 |
| Male householder, no wife present, family | 245 |
| Female householder, no husband present, family | 932 |
| Nonfamily households | 4,402 |
| Average household size | 2.12 |
| Average family size | 2.89 |
Economic characteristics in WEST COLUMBIA, SC
| Total households | 8,059 |
| Less than $10,000 | 532 |
| $10,000 to $14,999 | 429 |
| $15,000 to $24,999 | 1,103 |
| $25,000 to $34,999 | 1,015 |
| $35,000 to $49,999 | 1,416 |
| $50,000 to $74,999 | 1,416 |
| $75,000 to $99,999 | 1,104 |
| $100,000 to $149,999 | 612 |
| $150,000 to $199,999 | 231 |
| $200,000 or more | 201 |
| Median household income (dollars) | 45,082 |
Housing characteristics in WEST COLUMBIA, SC
| Total housing units | 8,965 |
| Occupied housing units | 8,059 |
| Vacant housing units | 906 |
| Total housing units | 8,965 |
| 1-unit, detached | 5,408 |
| 1-unit, attached | 139 |
| 2 units | 596 |
| 3 or 4 units | 649 |
| 5 to 9 units | 322 |
| 10 to 19 units | 487 |
| 20 or more units | 758 |
| Mobile home | 601 |
| Boat, RV, van, etc. | 5 |
| Total housing units | 8,965 |
| Built 2014 or later | 107 |
| Built 2010 to 2013 | 408 |
| Built 2000 to 2009 | 1,205 |
| Built 1990 to 1999 | 725 |
| Built 1980 to 1989 | 721 |
| Built 1970 to 1979 | 1,217 |
| Built 1960 to 1969 | 2,103 |
| Built 1950 to 1959 | 1,645 |
| Built 1940 to 1949 | 361 |
| Built 1939 or earlier | 473 |
| Total housing units | 8,965 |
| 1 room | 162 |
| 2 rooms | 100 |
| 3 rooms | 530 |
| 4 rooms | 2,770 |
| 5 rooms | 1,982 |
| 6 rooms | 1,513 |
| 7 rooms | 1,013 |
| 8 rooms | 477 |
| 9 rooms or more | 418 |
| Median rooms | 5.0 |
| Total housing units | 8,965 |
| No bedroom | 162 |
| 1 bedroom | 710 |
| 2 bedrooms | 3,704 |
| 3 bedrooms | 3,344 |
| 4 bedrooms | 916 |
| 5 or more bedrooms | 129 |
| Occupied housing units | 8,059 |
| Owner-occupied | 4,255 |
| Renter-occupied | 3,804 |
| Average household size of owner-occupied unit | 1.98 |
| Average household size of renter-occupied unit | 2.29 |
| Occupied housing units | 8,059 |
| Moved in 2017 or later | 378 |
| Moved in 2015 to 2016 | 1,279 |
| Moved in 2010 to 2014 | 2,501 |
| Moved in 2000 to 2009 | 1,907 |
| Moved in 1990 to 1999 | 811 |
| Moved in 1989 and earlier | 1,183 |
| Owner-occupied units | 4,255 |
| Less than $50,000 | 227 |
| $50,000 to $99,999 | 1,079 |
| $100,000 to $149,999 | 1,202 |
| $150,000 to $199,999 | 1,064 |
| $200,000 to $299,999 | 480 |
| $300,000 to $499,999 | 123 |
| $500,000 to $999,999 | 80 |
| $1,000,000 or more | 0 |
| Median (dollars) | 133,900 |
| Owner-occupied units | 4,255 |
| Housing units with a mortgage | 2,336 |
| Housing units without a mortgage | 1,919 |
| Occupied units paying rent | 3,618 |
| Less than $500 | 100 |
| $500 to $999 | 2,347 |
| $1,000 to $1,499 | 873 |
| $1,500 to $1,999 | 120 |
| $2,000 to $2,499 | 57 |
| $2,500 to $2,999 | 53 |
| $3,000 or more | 68 |
| Median (dollars) | 874 |
| No rent paid | 186 |
Data is based on 2018 Census
ZIP Codes for other locations
State for WEST COLUMBIA
South Carolina ZIP CodesOther cities in South Carolina