MAYNARDVILLE, TN ZIP Code
| City | MAYNARDVILLE |
| State | Tennessee |
| ZIP Codes count | 1 (see all) |
| Post offices count | 1 (see all) |
| Total population | 2,724 (see all) |
ZIP Code in MAYNARDVILLE, Tennessee
37807
This list contains only 5-digit ZIP codes. Use our zip code lookup by address feature to get the full 9-digit (ZIP+4) code.
List of MAYNARDVILLE, TN ZIP Codes
| ZIP | TYPE | POPU |
|---|---|---|
| 37807 | STANDARD | 11,338 |
Post offices
MAYNARDVILLE — Post Office™ 3009 MAYNARDVILLE HWY MAYNARDVILLE, TN 37807-9998 |
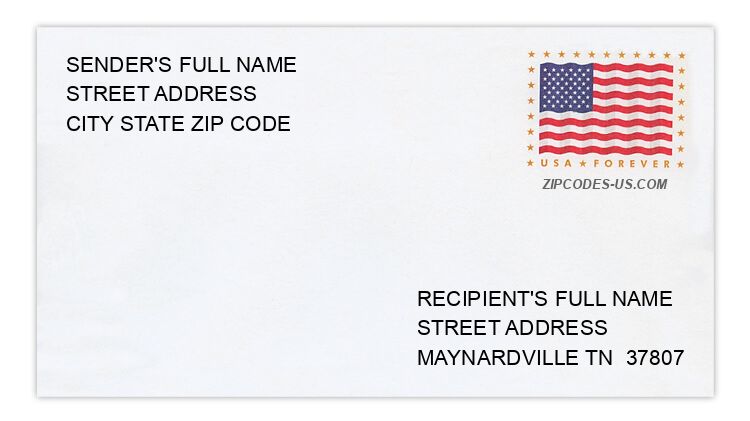
Envelope example
On the bottom center of the envelope, write the address you want your letter delivered to. Include the following on separate lines:
- Recipient's full name
- Full street address
- City, State, and ZIP Code
Using the same format, write the return address in the top left corner.
Using the full ZIP+4 Code when mailing via the USPS ensures the fastest, most accurate mailing possible. If you are not sure of the full 9-digit ZIP Code, use the 5-digit ZIP Code to avoid loss of letter or package.
The recipient address information is provided for your reference.
Address example
135 BREEDING LN
MAYNARDVILLE TN 37807-3156
MAYNARDVILLE TN 37807-3156
152 CHURCH ST
MAYNARDVILLE TN 37807-3704
MAYNARDVILLE TN 37807-3704
252 GRAY RD
MAYNARDVILLE TN 37807-4319
MAYNARDVILLE TN 37807-4319
131 OAKLAND RD
MAYNARDVILLE TN 37807-3335
MAYNARDVILLE TN 37807-3335
174 PINE LN
MAYNARDVILLE TN 37807-2723
MAYNARDVILLE TN 37807-2723
181 REECE LAKEVIEW LN
MAYNARDVILLE TN 37807-5066
MAYNARDVILLE TN 37807-5066
Map
Hover over the map to see the ZIP code
Census data for MAYNARDVILLE, TN
Demographic and housing estimates in MAYNARDVILLE, TN
| Total population | 2,724 |
| Male | 1,361 |
| Female | 1,363 |
| Total population | 2,724 |
| Under 5 years | 178 |
| 5 to 9 years | 149 |
| 10 to 14 years | 280 |
| 15 to 19 years | 229 |
| 20 to 24 years | 181 |
| 25 to 34 years | 295 |
| 35 to 44 years | 375 |
| 45 to 54 years | 347 |
| 55 to 59 years | 111 |
| 60 to 64 years | 175 |
| 65 to 74 years | 215 |
| 75 to 84 years | 124 |
| 85 years and over | 65 |
| Median age (years) | 35.9 |
| Under 18 years | 752 |
| 16 years and over | 2,076 |
| 18 years and over | 1,972 |
| 21 years and over | 1,838 |
| 62 years and over | 483 |
| 65 years and over | 404 |
| Total population | 2,724 |
| One race | 2,712 |
| White | 2,605 |
| Black or African American | 63 |
| American Indian and Alaska Native | 0 |
| Asian | 0 |
| Native Hawaiian and Other Pacific Islander | 44 |
| Some other race | 0 |
| Two or more races | 12 |
| Citizen, VOTING AGE 18 and over population | 1,968 |
| Male Citizen, VOTING AGE 18 and over population | 994 |
| Female Citizen, VOTING AGE 18 and over population | 974 |
Social characteristics in MAYNARDVILLE, TN
| Total households | 945 |
| Family households (families) | 580 |
| Married-couple family | 391 |
| Male householder, no wife present, family | 78 |
| Female householder, no husband present, family | 111 |
| Nonfamily households | 365 |
| Average household size | 2.70 |
| Average family size | 3.44 |
Economic characteristics in MAYNARDVILLE, TN
| Total households | 945 |
| Less than $10,000 | 130 |
| $10,000 to $14,999 | 93 |
| $15,000 to $24,999 | 81 |
| $25,000 to $34,999 | 161 |
| $35,000 to $49,999 | 171 |
| $50,000 to $74,999 | 118 |
| $75,000 to $99,999 | 119 |
| $100,000 to $149,999 | 45 |
| $150,000 to $199,999 | 27 |
| $200,000 or more | 0 |
| Median household income (dollars) | 35,987 |
Housing characteristics in MAYNARDVILLE, TN
| Total housing units | 1,145 |
| Occupied housing units | 945 |
| Vacant housing units | 200 |
| Total housing units | 1,145 |
| 1-unit, detached | 580 |
| 1-unit, attached | 30 |
| 2 units | 0 |
| 3 or 4 units | 66 |
| 5 to 9 units | 219 |
| 10 to 19 units | 44 |
| 20 or more units | 0 |
| Mobile home | 206 |
| Boat, RV, van, etc. | 0 |
| Total housing units | 1,145 |
| Built 2014 or later | 16 |
| Built 2010 to 2013 | 22 |
| Built 2000 to 2009 | 274 |
| Built 1990 to 1999 | 277 |
| Built 1980 to 1989 | 244 |
| Built 1970 to 1979 | 117 |
| Built 1960 to 1969 | 90 |
| Built 1950 to 1959 | 29 |
| Built 1940 to 1949 | 25 |
| Built 1939 or earlier | 51 |
| Total housing units | 1,145 |
| 1 room | 49 |
| 2 rooms | 3 |
| 3 rooms | 110 |
| 4 rooms | 349 |
| 5 rooms | 283 |
| 6 rooms | 131 |
| 7 rooms | 92 |
| 8 rooms | 87 |
| 9 rooms or more | 41 |
| Median rooms | 4.7 |
| Total housing units | 1,145 |
| No bedroom | 49 |
| 1 bedroom | 96 |
| 2 bedrooms | 463 |
| 3 bedrooms | 453 |
| 4 bedrooms | 69 |
| 5 or more bedrooms | 15 |
| Occupied housing units | 945 |
| Owner-occupied | 463 |
| Renter-occupied | 482 |
| Average household size of owner-occupied unit | 2.61 |
| Average household size of renter-occupied unit | 2.78 |
| Occupied housing units | 945 |
| Moved in 2017 or later | 43 |
| Moved in 2015 to 2016 | 198 |
| Moved in 2010 to 2014 | 243 |
| Moved in 2000 to 2009 | 209 |
| Moved in 1990 to 1999 | 143 |
| Moved in 1989 and earlier | 109 |
| Owner-occupied units | 463 |
| Less than $50,000 | 44 |
| $50,000 to $99,999 | 188 |
| $100,000 to $149,999 | 105 |
| $150,000 to $199,999 | 61 |
| $200,000 to $299,999 | 39 |
| $300,000 to $499,999 | 21 |
| $500,000 to $999,999 | 0 |
| $1,000,000 or more | 5 |
| Median (dollars) | 99,900 |
| Owner-occupied units | 463 |
| Housing units with a mortgage | 281 |
| Housing units without a mortgage | 182 |
| Occupied units paying rent | 434 |
| Less than $500 | 141 |
| $500 to $999 | 278 |
| $1,000 to $1,499 | 11 |
| $1,500 to $1,999 | 4 |
| $2,000 to $2,499 | 0 |
| $2,500 to $2,999 | 0 |
| $3,000 or more | 0 |
| Median (dollars) | 619 |
| No rent paid | 48 |
Data is based on 2018 Census
ZIP Codes for other locations
State for MAYNARDVILLE
Tennessee ZIP CodesOther cities in Tennessee