GARLAND, UT ZIP Code
| City | GARLAND |
| State | Utah |
| ZIP Codes count | 1 (see all) |
| Post offices count | 1 (see all) |
| Total population | 2,487 (see all) |
ZIP Code in GARLAND, Utah
84312
This list contains only 5-digit ZIP codes. Use our zip code lookup by address feature to get the full 9-digit (ZIP+4) code.
List of GARLAND, UT ZIP Codes
| ZIP | TYPE | POPU |
|---|---|---|
| 84312 | STANDARD | 4,928 |
Post offices
GARLAND — Post Office™ 11 N MAIN ST GARLAND, UT 84312-8001 |
Envelope example
On the bottom center of the envelope, write the address you want your letter delivered to. Include the following on separate lines:
- Recipient's full name
- Full street address
- City, State, and ZIP Code
Using the same format, write the return address in the top left corner.
Using the full ZIP+4 Code when mailing via the USPS ensures the fastest, most accurate mailing possible. If you are not sure of the full 9-digit ZIP Code, use the 5-digit ZIP Code to avoid loss of letter or package.
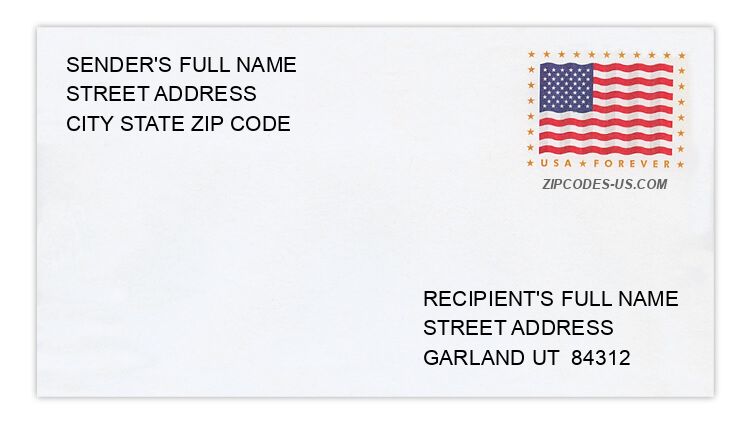
The recipient address information is provided for your reference.
Address example
866 COTTONWOOD CT
GARLAND UT 84312-9732
GARLAND UT 84312-9732
75 E 500 S
GARLAND UT 84312-9422
GARLAND UT 84312-9422
153 E FACTORY ST
GARLAND UT 84312-9799
GARLAND UT 84312-9799
39 S 100 E
GARLAND UT 84312-9301
GARLAND UT 84312-9301
244 S 125 E
GARLAND UT 84312-9426
GARLAND UT 84312-9426
27 S 150 E
GARLAND UT 84312-9414
GARLAND UT 84312-9414
Map
Hover over the map to see the ZIP code
Census data for GARLAND, UT
Demographic and housing estimates in GARLAND, UT
| Total population | 2,487 |
| Male | 1,276 |
| Female | 1,211 |
| Total population | 2,487 |
| Under 5 years | 280 |
| 5 to 9 years | 289 |
| 10 to 14 years | 215 |
| 15 to 19 years | 131 |
| 20 to 24 years | 120 |
| 25 to 34 years | 433 |
| 35 to 44 years | 285 |
| 45 to 54 years | 281 |
| 55 to 59 years | 81 |
| 60 to 64 years | 135 |
| 65 to 74 years | 126 |
| 75 to 84 years | 89 |
| 85 years and over | 22 |
| Median age (years) | 30.1 |
| Under 18 years | 872 |
| 16 years and over | 1,656 |
| 18 years and over | 1,615 |
| 21 years and over | 1,546 |
| 62 years and over | 307 |
| 65 years and over | 237 |
| Total population | 2,487 |
| One race | 2,468 |
| White | 2,343 |
| Black or African American | 0 |
| American Indian and Alaska Native | 82 |
| Asian | 32 |
| Native Hawaiian and Other Pacific Islander | 3 |
| Some other race | 8 |
| Two or more races | 19 |
| Citizen, VOTING AGE 18 and over population | 1,547 |
| Male Citizen, VOTING AGE 18 and over population | 786 |
| Female Citizen, VOTING AGE 18 and over population | 761 |
Social characteristics in GARLAND, UT
| Total households | 802 |
| Family households (families) | 653 |
| Married-couple family | 540 |
| Male householder, no wife present, family | 46 |
| Female householder, no husband present, family | 67 |
| Nonfamily households | 149 |
| Average household size | 3.10 |
| Average family size | 3.53 |
Economic characteristics in GARLAND, UT
| Total households | 802 |
| Less than $10,000 | 31 |
| $10,000 to $14,999 | 32 |
| $15,000 to $24,999 | 36 |
| $25,000 to $34,999 | 66 |
| $35,000 to $49,999 | 184 |
| $50,000 to $74,999 | 207 |
| $75,000 to $99,999 | 131 |
| $100,000 to $149,999 | 100 |
| $150,000 to $199,999 | 11 |
| $200,000 or more | 4 |
| Median household income (dollars) | 57,841 |
Housing characteristics in GARLAND, UT
| Total housing units | 848 |
| Occupied housing units | 802 |
| Vacant housing units | 46 |
| Total housing units | 848 |
| 1-unit, detached | 733 |
| 1-unit, attached | 32 |
| 2 units | 12 |
| 3 or 4 units | 63 |
| 5 to 9 units | 0 |
| 10 to 19 units | 0 |
| 20 or more units | 0 |
| Mobile home | 8 |
| Boat, RV, van, etc. | 0 |
| Total housing units | 848 |
| Built 2014 or later | 5 |
| Built 2010 to 2013 | 3 |
| Built 2000 to 2009 | 151 |
| Built 1990 to 1999 | 109 |
| Built 1980 to 1989 | 83 |
| Built 1970 to 1979 | 131 |
| Built 1960 to 1969 | 56 |
| Built 1950 to 1959 | 95 |
| Built 1940 to 1949 | 52 |
| Built 1939 or earlier | 163 |
| Total housing units | 848 |
| 1 room | 0 |
| 2 rooms | 0 |
| 3 rooms | 36 |
| 4 rooms | 95 |
| 5 rooms | 103 |
| 6 rooms | 127 |
| 7 rooms | 159 |
| 8 rooms | 111 |
| 9 rooms or more | 217 |
| Median rooms | 6.9 |
| Total housing units | 848 |
| No bedroom | 0 |
| 1 bedroom | 24 |
| 2 bedrooms | 140 |
| 3 bedrooms | 296 |
| 4 bedrooms | 198 |
| 5 or more bedrooms | 190 |
| Occupied housing units | 802 |
| Owner-occupied | 603 |
| Renter-occupied | 199 |
| Average household size of owner-occupied unit | 3.07 |
| Average household size of renter-occupied unit | 3.18 |
| Occupied housing units | 802 |
| Moved in 2017 or later | 33 |
| Moved in 2015 to 2016 | 141 |
| Moved in 2010 to 2014 | 232 |
| Moved in 2000 to 2009 | 155 |
| Moved in 1990 to 1999 | 96 |
| Moved in 1989 and earlier | 145 |
| Owner-occupied units | 603 |
| Less than $50,000 | 6 |
| $50,000 to $99,999 | 53 |
| $100,000 to $149,999 | 216 |
| $150,000 to $199,999 | 139 |
| $200,000 to $299,999 | 152 |
| $300,000 to $499,999 | 37 |
| $500,000 to $999,999 | 0 |
| $1,000,000 or more | 0 |
| Median (dollars) | 158,600 |
| Owner-occupied units | 603 |
| Housing units with a mortgage | 423 |
| Housing units without a mortgage | 180 |
| Occupied units paying rent | 165 |
| Less than $500 | 0 |
| $500 to $999 | 129 |
| $1,000 to $1,499 | 25 |
| $1,500 to $1,999 | 11 |
| $2,000 to $2,499 | 0 |
| $2,500 to $2,999 | 0 |
| $3,000 or more | 0 |
| Median (dollars) | 751 |
| No rent paid | 34 |
Data is based on 2018 Census
ZIP Codes for other locations
State for GARLAND
Utah ZIP CodesOther cities in Utah