HYRUM, UT ZIP Code
| City | HYRUM |
| State | Utah |
| ZIP Codes count | 1 (see all) |
| Post offices count | 1 (see all) |
| Total population | 8,065 (see all) |
ZIP Code in HYRUM, Utah
84319
This list contains only 5-digit ZIP codes. Use our zip code lookup by address feature to get the full 9-digit (ZIP+4) code.
List of HYRUM, UT ZIP Codes
| ZIP | TYPE | POPU |
|---|---|---|
| 84319 | STANDARD | 9,745 |
Post offices
HYRUM — Post Office™ 45 E MAIN ST HYRUM, UT 84319-9998 |
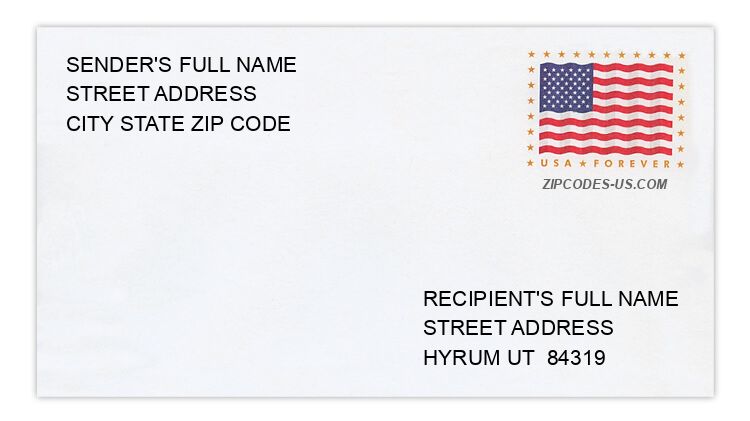
Envelope example
On the bottom center of the envelope, write the address you want your letter delivered to. Include the following on separate lines:
- Recipient's full name
- Full street address
- City, State, and ZIP Code
Using the same format, write the return address in the top left corner.
Using the full ZIP+4 Code when mailing via the USPS ensures the fastest, most accurate mailing possible. If you are not sure of the full 9-digit ZIP Code, use the 5-digit ZIP Code to avoid loss of letter or package.
The recipient address information is provided for your reference.
Address example
43 E MAIN ST
HYRUM UT 84319-1309
HYRUM UT 84319-1309
285 N 400 W
HYRUM UT 84319-1055
HYRUM UT 84319-1055
475 PANORAMIC DR
HYRUM UT 84319-1168
HYRUM UT 84319-1168
79 PARK AVE
HYRUM UT 84319-1445
HYRUM UT 84319-1445
396 S CENTER ST
HYRUM UT 84319-1605
HYRUM UT 84319-1605
24 S SOUTHCACHE LOOP
HYRUM UT 84319-1343
HYRUM UT 84319-1343
Map
Hover over the map to see the ZIP code
Census data for HYRUM, UT
Demographic and housing estimates in HYRUM, UT
| Total population | 8,065 |
| Male | 4,169 |
| Female | 3,896 |
| Total population | 8,065 |
| Under 5 years | 916 |
| 5 to 9 years | 886 |
| 10 to 14 years | 690 |
| 15 to 19 years | 925 |
| 20 to 24 years | 573 |
| 25 to 34 years | 938 |
| 35 to 44 years | 1,249 |
| 45 to 54 years | 659 |
| 55 to 59 years | 310 |
| 60 to 64 years | 382 |
| 65 to 74 years | 313 |
| 75 to 84 years | 194 |
| 85 years and over | 30 |
| Median age (years) | 26.1 |
| Under 18 years | 3,142 |
| 16 years and over | 5,318 |
| 18 years and over | 4,923 |
| 21 years and over | 4,523 |
| 62 years and over | 743 |
| 65 years and over | 537 |
| Total population | 8,065 |
| One race | 7,865 |
| White | 7,318 |
| Black or African American | 52 |
| American Indian and Alaska Native | 74 |
| Asian | 0 |
| Native Hawaiian and Other Pacific Islander | 81 |
| Some other race | 340 |
| Two or more races | 200 |
| Citizen, VOTING AGE 18 and over population | 4,518 |
| Male Citizen, VOTING AGE 18 and over population | 2,265 |
| Female Citizen, VOTING AGE 18 and over population | 2,253 |
Social characteristics in HYRUM, UT
| Total households | 2,224 |
| Family households (families) | 1,960 |
| Married-couple family | 1,661 |
| Male householder, no wife present, family | 110 |
| Female householder, no husband present, family | 189 |
| Nonfamily households | 264 |
| Average household size | 3.63 |
| Average family size | 3.89 |
Economic characteristics in HYRUM, UT
| Total households | 2,224 |
| Less than $10,000 | 30 |
| $10,000 to $14,999 | 89 |
| $15,000 to $24,999 | 140 |
| $25,000 to $34,999 | 204 |
| $35,000 to $49,999 | 349 |
| $50,000 to $74,999 | 558 |
| $75,000 to $99,999 | 457 |
| $100,000 to $149,999 | 287 |
| $150,000 to $199,999 | 47 |
| $200,000 or more | 63 |
| Median household income (dollars) | 61,802 |
Housing characteristics in HYRUM, UT
| Total housing units | 2,333 |
| Occupied housing units | 2,224 |
| Vacant housing units | 109 |
| Total housing units | 2,333 |
| 1-unit, detached | 1,779 |
| 1-unit, attached | 157 |
| 2 units | 9 |
| 3 or 4 units | 125 |
| 5 to 9 units | 79 |
| 10 to 19 units | 0 |
| 20 or more units | 18 |
| Mobile home | 166 |
| Boat, RV, van, etc. | 0 |
| Total housing units | 2,333 |
| Built 2014 or later | 74 |
| Built 2010 to 2013 | 91 |
| Built 2000 to 2009 | 425 |
| Built 1990 to 1999 | 452 |
| Built 1980 to 1989 | 148 |
| Built 1970 to 1979 | 612 |
| Built 1960 to 1969 | 152 |
| Built 1950 to 1959 | 89 |
| Built 1940 to 1949 | 30 |
| Built 1939 or earlier | 260 |
| Total housing units | 2,333 |
| 1 room | 15 |
| 2 rooms | 0 |
| 3 rooms | 18 |
| 4 rooms | 403 |
| 5 rooms | 288 |
| 6 rooms | 361 |
| 7 rooms | 265 |
| 8 rooms | 391 |
| 9 rooms or more | 592 |
| Median rooms | 6.8 |
| Total housing units | 2,333 |
| No bedroom | 15 |
| 1 bedroom | 23 |
| 2 bedrooms | 494 |
| 3 bedrooms | 782 |
| 4 bedrooms | 552 |
| 5 or more bedrooms | 467 |
| Occupied housing units | 2,224 |
| Owner-occupied | 1,719 |
| Renter-occupied | 505 |
| Average household size of owner-occupied unit | 3.79 |
| Average household size of renter-occupied unit | 3.06 |
| Occupied housing units | 2,224 |
| Moved in 2017 or later | 158 |
| Moved in 2015 to 2016 | 328 |
| Moved in 2010 to 2014 | 547 |
| Moved in 2000 to 2009 | 695 |
| Moved in 1990 to 1999 | 237 |
| Moved in 1989 and earlier | 259 |
| Owner-occupied units | 1,719 |
| Less than $50,000 | 88 |
| $50,000 to $99,999 | 54 |
| $100,000 to $149,999 | 444 |
| $150,000 to $199,999 | 515 |
| $200,000 to $299,999 | 467 |
| $300,000 to $499,999 | 117 |
| $500,000 to $999,999 | 28 |
| $1,000,000 or more | 6 |
| Median (dollars) | 172,900 |
| Owner-occupied units | 1,719 |
| Housing units with a mortgage | 1,217 |
| Housing units without a mortgage | 502 |
| Occupied units paying rent | 505 |
| Less than $500 | 71 |
| $500 to $999 | 290 |
| $1,000 to $1,499 | 136 |
| $1,500 to $1,999 | 8 |
| $2,000 to $2,499 | 0 |
| $2,500 to $2,999 | 0 |
| $3,000 or more | 0 |
| Median (dollars) | 756 |
| No rent paid | 0 |
Data is based on 2018 Census
ZIP Codes for other locations
State for HYRUM
Utah ZIP CodesOther cities in Utah