SALEM, UT ZIP Code
| City | SALEM |
| State | Utah |
| ZIP Codes count | 1 (see all) |
| Post offices count | 1 (see all) |
| Total population | 7,808 (see all) |
ZIP Code in SALEM, Utah
84653
This list contains only 5-digit ZIP codes. Use our zip code lookup by address feature to get the full 9-digit (ZIP+4) code.
List of SALEM, UT ZIP Codes
| ZIP | TYPE | POPU |
|---|---|---|
| 84653 | STANDARD | 10,869 |
Post offices
SALEM — Post Office™ 134 E 200 N SALEM, UT 84653-8001 |
Envelope example
On the bottom center of the envelope, write the address you want your letter delivered to. Include the following on separate lines:
- Recipient's full name
- Full street address
- City, State, and ZIP Code
Using the same format, write the return address in the top left corner.
Using the full ZIP+4 Code when mailing via the USPS ensures the fastest, most accurate mailing possible. If you are not sure of the full 9-digit ZIP Code, use the 5-digit ZIP Code to avoid loss of letter or package.
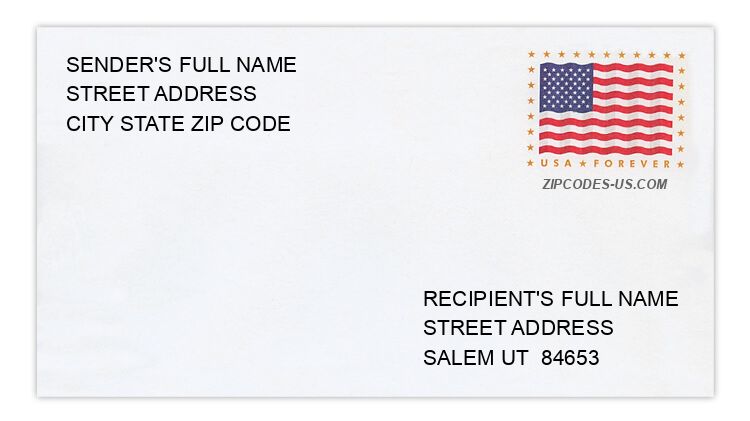
The recipient address information is provided for your reference.
Address example
175 E SALEM CANAL RD
SALEM UT 84653-9532
SALEM UT 84653-9532
1871 N 1260 W
SALEM UT 84653-5595
SALEM UT 84653-5595
1787 N SPARROW WAY
SALEM UT 84653-5707
SALEM UT 84653-5707
28 SHADY LN
SALEM UT 84653-9502
SALEM UT 84653-9502
369 W 1650 S
SALEM UT 84653-5730
SALEM UT 84653-5730
73 W 9370
SALEM UT 84653-9289
SALEM UT 84653-9289
Map
Hover over the map to see the ZIP code
Census data for SALEM, UT
Demographic and housing estimates in SALEM, UT
| Total population | 7,808 |
| Male | 4,060 |
| Female | 3,748 |
| Total population | 7,808 |
| Under 5 years | 573 |
| 5 to 9 years | 713 |
| 10 to 14 years | 1,033 |
| 15 to 19 years | 911 |
| 20 to 24 years | 579 |
| 25 to 34 years | 709 |
| 35 to 44 years | 1,066 |
| 45 to 54 years | 738 |
| 55 to 59 years | 352 |
| 60 to 64 years | 469 |
| 65 to 74 years | 415 |
| 75 to 84 years | 202 |
| 85 years and over | 48 |
| Median age (years) | 26.6 |
| Under 18 years | 2,896 |
| 16 years and over | 5,205 |
| 18 years and over | 4,912 |
| 21 years and over | 4,412 |
| 62 years and over | 958 |
| 65 years and over | 665 |
| Total population | 7,808 |
| One race | 7,576 |
| White | 7,427 |
| Black or African American | 18 |
| American Indian and Alaska Native | 0 |
| Asian | 35 |
| Native Hawaiian and Other Pacific Islander | 27 |
| Some other race | 69 |
| Two or more races | 232 |
| Citizen, VOTING AGE 18 and over population | 4,857 |
| Male Citizen, VOTING AGE 18 and over population | 2,579 |
| Female Citizen, VOTING AGE 18 and over population | 2,278 |
Social characteristics in SALEM, UT
| Total households | 1,977 |
| Family households (families) | 1,780 |
| Married-couple family | 1,631 |
| Male householder, no wife present, family | 61 |
| Female householder, no husband present, family | 88 |
| Nonfamily households | 197 |
| Average household size | 3.95 |
| Average family size | 4.26 |
Economic characteristics in SALEM, UT
| Total households | 1,977 |
| Less than $10,000 | 60 |
| $10,000 to $14,999 | 19 |
| $15,000 to $24,999 | 87 |
| $25,000 to $34,999 | 81 |
| $35,000 to $49,999 | 134 |
| $50,000 to $74,999 | 344 |
| $75,000 to $99,999 | 338 |
| $100,000 to $149,999 | 595 |
| $150,000 to $199,999 | 151 |
| $200,000 or more | 168 |
| Median household income (dollars) | 92,618 |
Housing characteristics in SALEM, UT
| Total housing units | 2,030 |
| Occupied housing units | 1,977 |
| Vacant housing units | 53 |
| Total housing units | 2,030 |
| 1-unit, detached | 1,897 |
| 1-unit, attached | 71 |
| 2 units | 31 |
| 3 or 4 units | 6 |
| 5 to 9 units | 0 |
| 10 to 19 units | 0 |
| 20 or more units | 0 |
| Mobile home | 25 |
| Boat, RV, van, etc. | 0 |
| Total housing units | 2,030 |
| Built 2014 or later | 126 |
| Built 2010 to 2013 | 160 |
| Built 2000 to 2009 | 583 |
| Built 1990 to 1999 | 479 |
| Built 1980 to 1989 | 169 |
| Built 1970 to 1979 | 310 |
| Built 1960 to 1969 | 17 |
| Built 1950 to 1959 | 12 |
| Built 1940 to 1949 | 38 |
| Built 1939 or earlier | 136 |
| Total housing units | 2,030 |
| 1 room | 0 |
| 2 rooms | 0 |
| 3 rooms | 4 |
| 4 rooms | 51 |
| 5 rooms | 178 |
| 6 rooms | 168 |
| 7 rooms | 358 |
| 8 rooms | 323 |
| 9 rooms or more | 948 |
| Median rooms | 8.3 |
| Total housing units | 2,030 |
| No bedroom | 0 |
| 1 bedroom | 11 |
| 2 bedrooms | 100 |
| 3 bedrooms | 553 |
| 4 bedrooms | 487 |
| 5 or more bedrooms | 879 |
| Occupied housing units | 1,977 |
| Owner-occupied | 1,755 |
| Renter-occupied | 222 |
| Average household size of owner-occupied unit | 4.00 |
| Average household size of renter-occupied unit | 3.56 |
| Occupied housing units | 1,977 |
| Moved in 2017 or later | 47 |
| Moved in 2015 to 2016 | 263 |
| Moved in 2010 to 2014 | 576 |
| Moved in 2000 to 2009 | 540 |
| Moved in 1990 to 1999 | 359 |
| Moved in 1989 and earlier | 192 |
| Owner-occupied units | 1,755 |
| Less than $50,000 | 17 |
| $50,000 to $99,999 | 0 |
| $100,000 to $149,999 | 32 |
| $150,000 to $199,999 | 144 |
| $200,000 to $299,999 | 574 |
| $300,000 to $499,999 | 786 |
| $500,000 to $999,999 | 184 |
| $1,000,000 or more | 18 |
| Median (dollars) | 319,400 |
| Owner-occupied units | 1,755 |
| Housing units with a mortgage | 1,224 |
| Housing units without a mortgage | 531 |
| Occupied units paying rent | 217 |
| Less than $500 | 10 |
| $500 to $999 | 57 |
| $1,000 to $1,499 | 79 |
| $1,500 to $1,999 | 62 |
| $2,000 to $2,499 | 9 |
| $2,500 to $2,999 | 0 |
| $3,000 or more | 0 |
| Median (dollars) | 1,146 |
| No rent paid | 5 |
Data is based on 2018 Census
ZIP Codes for other locations
State for SALEM
Utah ZIP CodesOther cities in Utah