SAINT ALBANS, VT ZIP Code
| City | SAINT ALBANS |
| State | Vermont |
| ZIP Codes count | 1 (see all) |
| Post offices count | 1 (see all) |
ZIP Code in SAINT ALBANS, Vermont
05478
This list contains only 5-digit ZIP codes. Use our zip code lookup by address feature to get the full 9-digit (ZIP+4) code.
List of SAINT ALBANS, VT ZIP Codes
| ZIP | TYPE | POPU |
|---|---|---|
| 05478 | STANDARD | 16,003 |
Post offices
SAINT ALBANS — Post Office™ 153 N MAIN ST SAINT ALBANS, VT 05478-9998 |
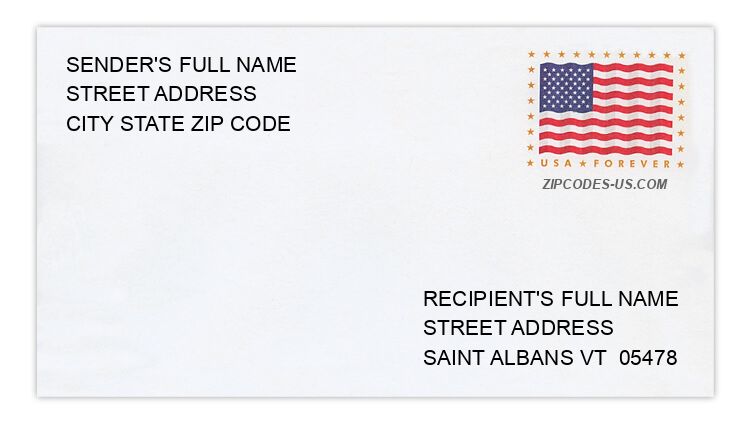
Envelope example
On the bottom center of the envelope, write the address you want your letter delivered to. Include the following on separate lines:
- Recipient's full name
- Full street address
- City, State, and ZIP Code
Using the same format, write the return address in the top left corner.
Using the full ZIP+4 Code when mailing via the USPS ensures the fastest, most accurate mailing possible. If you are not sure of the full 9-digit ZIP Code, use the 5-digit ZIP Code to avoid loss of letter or package.
The recipient address information is provided for your reference.
Address example
5 CREST RD
SAINT ALBANS VT 05478-9753
SAINT ALBANS VT 05478-9753
22 DEAL ST
SAINT ALBANS VT 05478-2118
SAINT ALBANS VT 05478-2118
175 NASON ST
SAINT ALBANS VT 05478-2355
SAINT ALBANS VT 05478-2355
26 NEW ST
SAINT ALBANS VT 05478-2311
SAINT ALBANS VT 05478-2311
84 RYAN LN
SAINT ALBANS VT 05478-4474
SAINT ALBANS VT 05478-4474
96 WHITEY DR
SAINT ALBANS VT 05478-4400
SAINT ALBANS VT 05478-4400
Map
Hover over the map to see the ZIP code
ZIP Codes for other locations
State for SAINT ALBANS
Vermont ZIP CodesOther cities in Vermont